. 2015 Dec 24;528(7583):560-564.
doi: 10.1038/nature16460. Epub 2015 Dec 9.

Interleukin-22 promotes intestinal-stem-cell-mediated epithelial regeneration

Affiliations

Interleukin-22 promotes intestinal-stem-cell-mediated epithelial regeneration

Caroline A Lindemans et al. Nature. .

Abstract

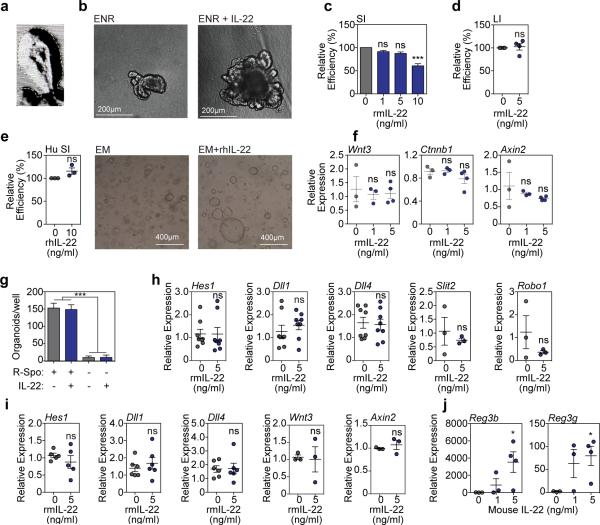
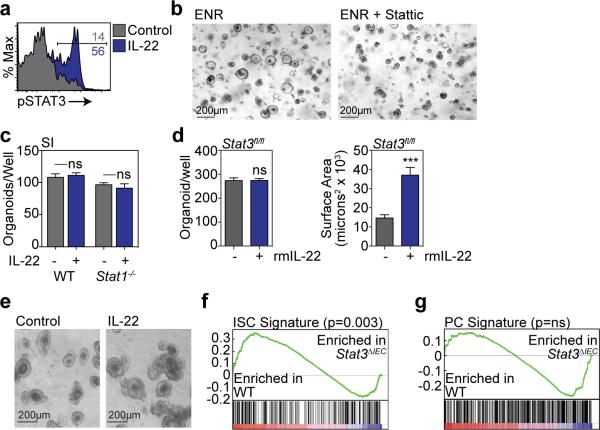
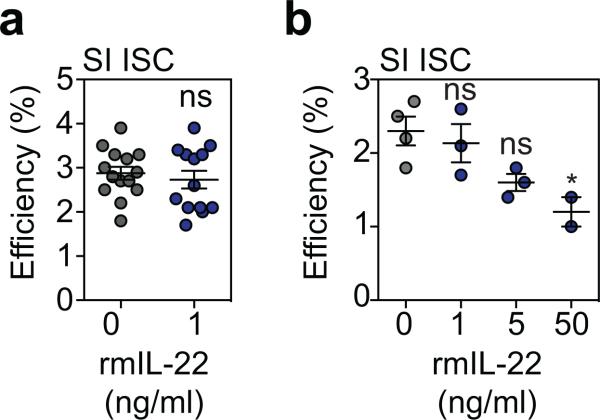
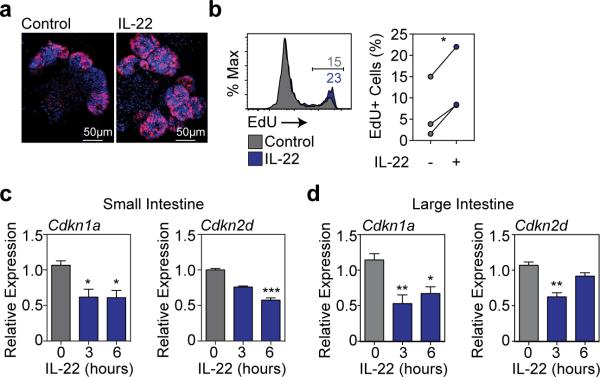
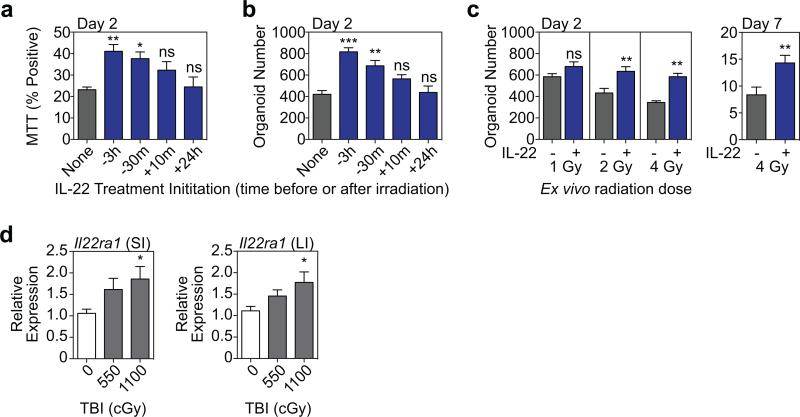
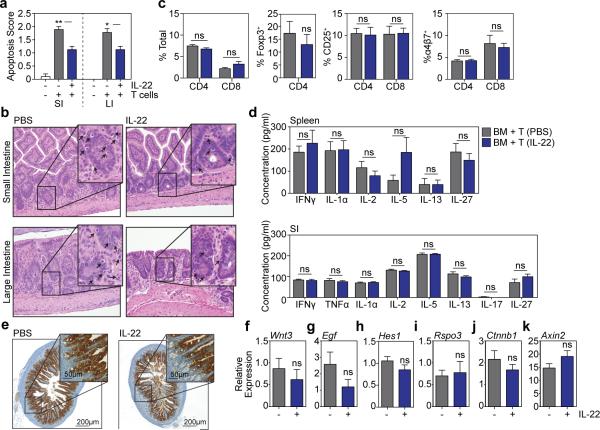
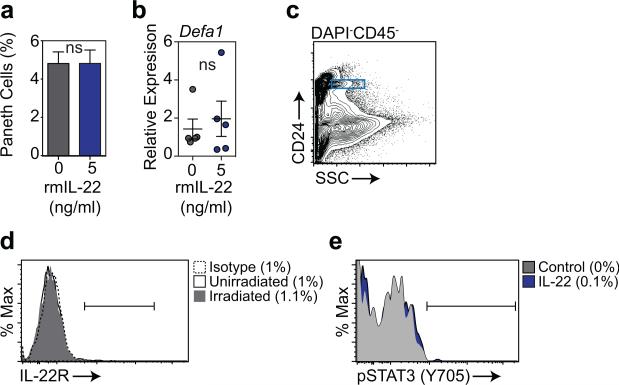
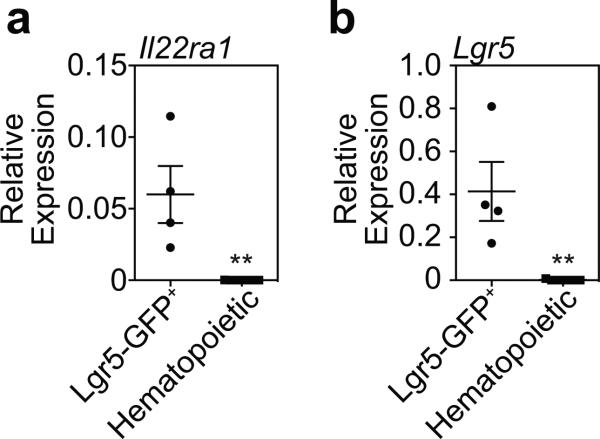
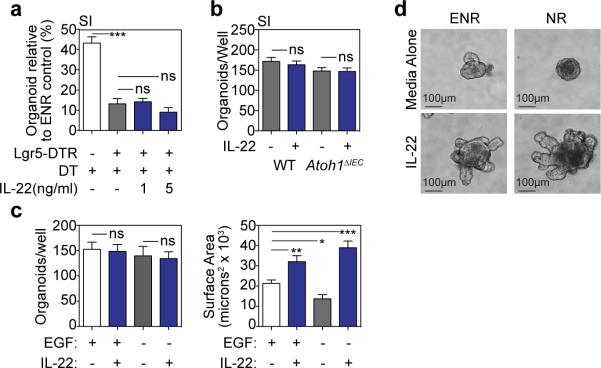
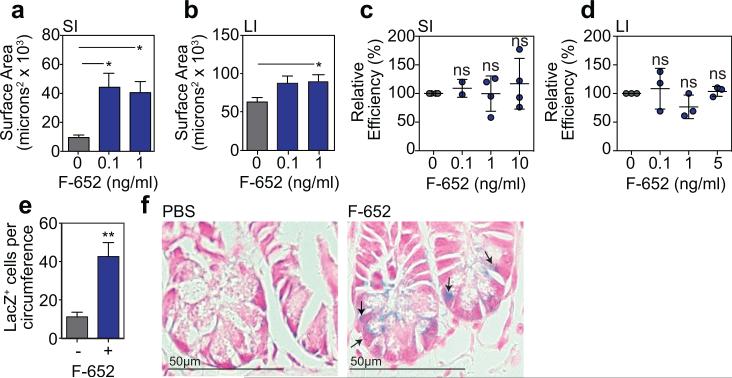
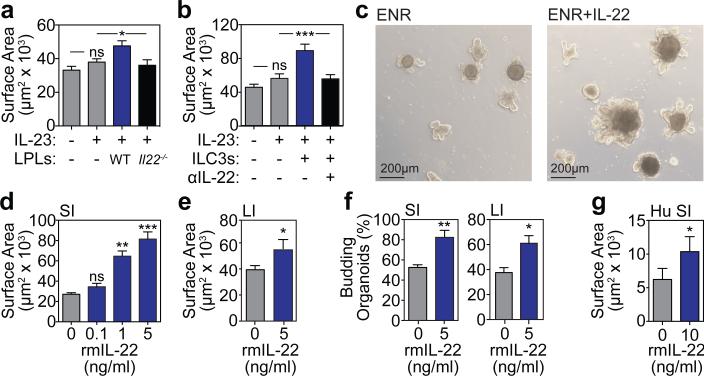
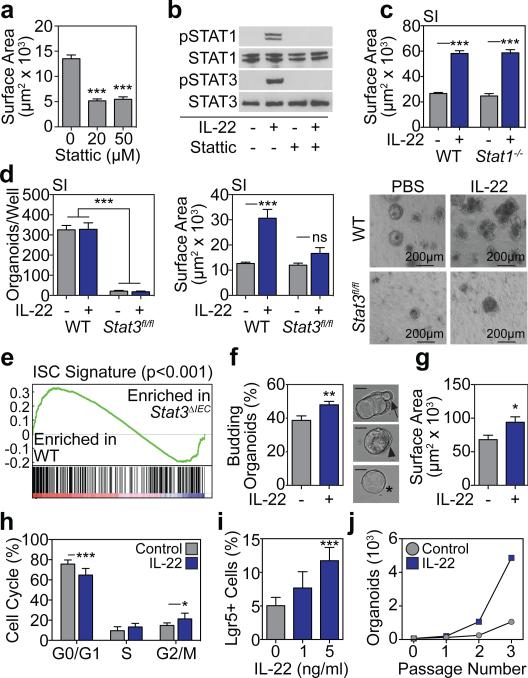
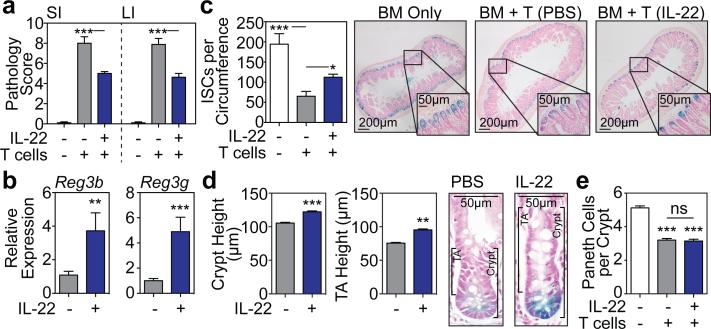
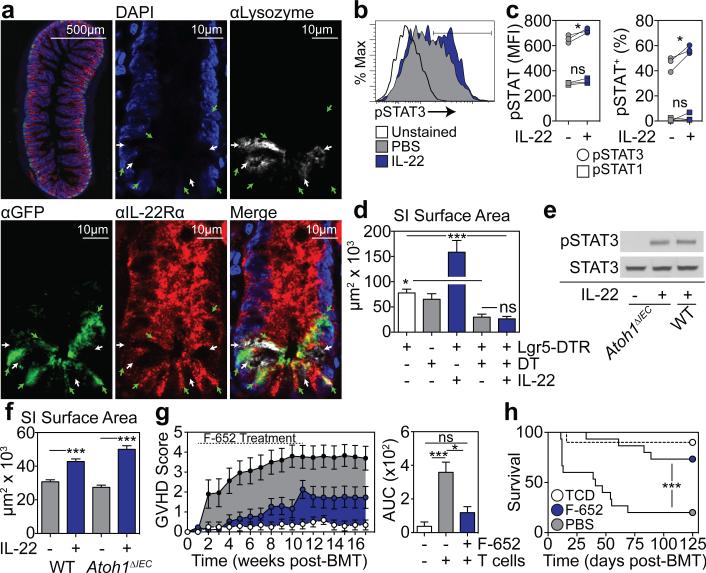
Epithelial regeneration is critical for barrier maintenance and organ function after intestinal injury. The intestinal stem cell (ISC) niche provides Wnt, Notch and epidermal growth factor (EGF) signals supporting Lgr5(+) crypt base columnar ISCs for normal epithelial maintenance. However, little is known about the regulation of the ISC compartment after tissue damage. Using ex vivo organoid cultures, here we show that innate lymphoid cells (ILCs), potent producers of interleukin-22 (IL-22) after intestinal injury, increase the growth of mouse small intestine organoids in an IL-22-dependent fashion. Recombinant IL-22 directly targeted ISCs, augmenting the growth of both mouse and human intestinal organoids, increasing proliferation and promoting ISC expansion. IL-22 induced STAT3 phosphorylation in Lgr5(+) ISCs, and STAT3 was crucial for both organoid formation and IL-22-mediated regeneration. Treatment with IL-22 in vivo after mouse allogeneic bone marrow transplantation enhanced the recovery of ISCs, increased epithelial regeneration and reduced intestinal pathology and mortality from graft-versus-host disease. ATOH1-deficient organoid culture demonstrated that IL-22 induced epithelial regeneration independently of the Paneth cell niche. Our findings reveal a fundamental mechanism by which the immune system is able to support the intestinal epithelium, activating ISCs to promote regeneration.


Figures

Extended Data Figure 1
a, Microscopic tracing of organoid to measure surface area. b, Brightfield images of SI organoids from B6 mice, after seven days of culture +/− IL-22 (5ng/ml). c-e, Organoid efficiency (%) relative to control (0 ng/ml) for (c) B6 SI organoids (statistics on data combined from n=19 wells/group from 19 individual mice), (d) B6 LI organoids (n=4 mice/group) cultured +/− rmIL-22 for 7 days, and (e) human SI organoids cultured +/− rhIL-22 for six days (n=3 donors/group). f, RT qPCR of relative mRNA expression of Wnt3, Ctnnb1, and Axin2 genes of the Wnt/β-catenin axis in SI organoids cultured +/− rmIL-22; n=3 (0-1ng/ml) and n=4 (5ng/ml) mice/group. g, Numbers of SI organoids/well +/− rmIL-22 (5ng/ml) in the presence or absence of R-spondin-1 (n=6 wells/group). h, RT qPCR-determined relative mRNA expression of notch pathway genes (Hes1, Dll1, Dll4; n=8 mice/group) as well as of Slit2 and its receptor Robo1 (n=3 mice/group) in day 7 SI organoids cultured +/− rmIL-22. i, Relative expression of Wnt3 and Axin2 (n=3 mice/group), Hes1 (n=5 mice/group), and Dll1 and Dll4 (n=6 mice/group) genes in LI organoids. j, RT qPCR for the relative mRNA expression of Reg3b and Reg3g innate antimicrobials in SI organoids cultured with rmIL-22; n=3 (0-1ng/ml) and n=4 (5ng/ml) mice/group. Organoid efficiency/number comparisons were performed with t-tests (two groups) or ANOVA (multiple groups). RT qPCRs statistics were performed with non-parametric Mann-Whitney (two groups) or Kruskal-Wallis (multiple groups) tests. Graphs demonstrate mean +/− SEM; ns: non-significant; *p<0.5, ***p< 0.001. Data combined from at least two independent experiments unless otherwise stated.
Extended Data Figure 2
a Intracellular staining of pStat3 (Y705) in organoid cells cultured under standard EGF, Noggin, and R-spondin-1 (ENR) conditions followed by a 20 minute pulse of 20 ng/ml IL-22, evaluated by flow cytometry; data representative of two independent experiments. b, Brightfield images of SI organoids 4 days after crypt culture +/− Stattic; data representative of three experiments. c, SI organoids/well from WT and Stat1−/− mice +/− rmIL-22; n=6 wells/group; ANOVA. d-e, Day 5 organoids from Stat3fl/fl SI crypt cells cultured +/− rmIL-22 (5ng/ml) in the absence of adeno-Cre infection; (d) numbers/well (n=6 wells/group) and size (n=35 control and n=42 IL-22-treated organoids/group), t-test; (e) brightfield images representative of three experiments. f-g, GSEAs of the expression of (f) a second independent ISC signature gene set (GSE36497) and (g) a negative control DLL1+CD24hi Paneth cell gene set (GSE39915) in Stat3fl/fl;Villin-Cre (WT) vs Stat3fl/fl;Villin-Cre+ (Stat3ΔIEC) mice with DSS colitis, using GEO database array data (GSE15955). Each GSEA represents one analysis; nominal p-values are shown. Bar graphs represent mean + SEM; ns: non-significant; ***p<0.001. Data combined from at least two independent experiments unless otherwise stated.
Extended Data Figure 3
a-b Organoid efficiency as % of plated cells, in organoid cultures from sorted Lgr5+ ISCs from B6 Lgr5-GFP reporter mice using (a) a concentration of 1 ng/ml (n=14 wells/group combined from three experiments; t-test) and (b) with a concentration range (one experiment, n=3 wells/group; ANOVA). Graphs indicate mean +/− SEM; ns: non-significant; *p<0.05.
Extended Data Figure 4
a-b, (a) Confocal images (nuclear staining, blue; and EdU staining, red; one experiment) and (b) FACS analysis of EdU incorporation (1hr) in SI organoids cultured in the presence or absence of rmIL-22 (1 ng/ml); histogram representative of two experiments, graph shows paired t-test, n=3 mice/group combined from two experiments. c-d, Cdkn1a (p21) and Cdkn2d (p19) mRNA expression (RT qPCR) in organoids cultured from (c) SI and (d) LI crypts for 24 hours with 0, 3, or 6 hours exposure to IL-22 prior to harvesting; Kruskal-Wallis analysis, n=6 mice/group combined from two independent experiments. All bar graphs represent mean + SEM; ns: non-significant; *p<0.05, **p< 0.01, ***p<.001.
Extended Data Figure 5
a-c, Dissociated single cells from WT B6 crypts were exposed to escalating doses of irradiation ex vivo. a-b, Crypt cells were plated three hours prior to irradiation, and cultures were treated with rmIL-22 (5ng/ml) added to the culture at 3 hours before, 30 minutes before, 10 minutes after, or 24 hours after 4 Gy irradiation. Two days after irradiation, organoids were evaluated for (a) MTT viability testing (% positive, n=6 wells/group) and (b) the number of organoids generated (n=6 wells/group). c, The effect of IL-22 after irradiation was evaluated by measuring organoid number two days and seven days after irradiation (Day 2: n=9 wells/group for 1-2 Gy and n=6 wells/group for 4 Gy; Day 7: 4 Gy, n=20 wells/group). Culture +/− IL-22 was initiated three hours prior to irradiation. d, Small and large intestine crypt Il22ra1 expression determined by qPCR; RNA isolated from fresh crypts of B6 mice harvested one day (20-26 hours) after total body irradiation; n=12 control and n=11 irradiated mice/group. Comparisons performed with t-tests (two groups) or ANOVA (multiple groups). Bar graphs represent mean + SEM; ns: non-significant; *p<0.05, **p<0.01, ***p<0.001. Data combined from at least two independent experiments.
Extended Data Figure 6
B6 recipient mice were transplanted with only TCD bone marrow from LP donors or with bone marrow and T cells from LP donors to induce GVHD (H-2bH-2b). Mice receiving T cells were treated daily with PBS or 4μg rmIL-22 by IP injection starting day 7 post-BMT. a, Pathologic scoring of apoptosis in intestinal tissues three weeks after BMT. Data from two experiments combined: TCD BM only mice (n=10), PBS-treated mice (n=9), and IL-22-treated mice (n=8); Kruskal-Wallis analysis. b, Representative haematoxylin and eosin staining of SI and LI. Arrows indicate apoptotic cells within the intestinal epithelium. c, Splenocytes from recipients were analyzed with flow cytometry three weeks after BMT, indicating frequencies of T cell subsets, expression of activation marker CD25, and expression of gut homing molecule α4β7 integrin; n=9 PBS-treated and n=10 IL-22-treated mice/group; t-test analysis. d, Expression of inflammatory cytokines in spleen (n=9 PBS-treated and n=10 IL-22-treated mice/group) and small intestine (n=10 mice/group) was analyzed in recipient tissues three weeks post-BMT; t-test analyses, multiple comparisons corrected for with Holm-Sidak correction. e, Reg3β immunohistochemistry staining in SI samples of recipient mice three weeks post-BMT, data representative of three experiments. f-k, RT qPCR of relative mRNA expression in SI tissue samples of PBS-treated vs. IL-22-treated mice 3 weeks post-BMT for: f, Wnt3; g, Egf; h, Hes1 (from purified crypts); i, Rspo3; j, Ctnnb1 (from purified crypts); k, Axin2 (from purified crypts); n=10 mice/group for purified crypt samples; n=8 (PBS-treated) and n=9 (IL-22-treated) mice/group for whole SI tissue samples; Mann-Whitney U test. Bar graphs represent mean + SEM; ns: non-significant; *p<0.05, **p<0.01. Data combined from two independent experiments unless stated otherwise.
Extended Data Figure 7
a, Percentage of Paneth cells in organoids cultured +/− 5 ng/ml rmIL-22 for 7 days, as evaluated by flow cytometry after dissociation into single cells; n=7 independent cultures/group (one mouse per culture); t-test. b, RT qPCR analysis of the relative mRNA expression of Paneth cell gene Defa1 in SI organoids cultured +/− 5 ng/ml rmIL-22 for 7 days; n=5 independent cultures/group (1-2 pooled mice/culture); Mann-Whitney U test. c-e, Paneth cell IL-22R expression and Stat3 phosphorylation assessed by flow cytometry. Shown are (c) gating of Paneth cells based on side scatter and CD24 expression, (d) Paneth cell IL-22R expression at baseline and five days after 1200 cGy total body irradiation (one of two experiments), and (e) Stat3 phosphorylation in Paneth cells as determined by phosflow of dissociated crypt cells after a 20 minute pulse with rmIL-22 (20 ng/ml, 37°C; one of one of two experiments). Graphs demonstrate mean +/− SEM; ns: non-significant. Data combined from at least four independent experiments unless otherwise stated.
Extended Data Figure 8
a, Relative mRNA expression of Il22ra1 in sorted Lgr5-GFP+ cells (n=4 biological replicates), with various sorted hematopoietic populations serving as negative controls, including intestinal dendritic cells (n=4), intestinal ILC3s (n=2), and splenic B cells (n=1). b, Lgr5 mRNA relative to Gapdh expression in sorted Lgr5-GFP+ cells and hematopoietic samples described above to confirm Lgr5 expression in sorted Lgr5-GFP+ cells. Graphs indicate mean +/− SEM; Mann-Whitney U tests; **p< 0.01.
Extended Data Figure 9
a, Efficiency of WT and Lgr5-DTR SI organoid formation after culture with DT (1ng/μl) to deplete Lgr5+ cells; one of three experiments; n=6 (WT), n=5 (Lgr5-DTR) n=6 (1ng/ml IL-22), n=6 (5ng/ml IL-22) wells/group. b, Numbers of WT and Atoh1ΔIEC day 7 SI organoids cultured +/− rmIL-22 (5ng/ml); n=6 wells/group. c-d, Omission of EGF from the standard ENR medium.c, The effect of IL-22 on organoid numbers and size in the absence of EGF; n=6 wells/group for numbers; n=45 (ENR), n=37 (ENR+IL-22), n=42 (NR), n=54 (NR+IL-22) organoids/group for size; data combined from three experiments. d, Brightfield images of WT SI organoid cultures in the presence or absence of EGF (50 ng/ml), representative of three experiments. Bar graphs represent mean + SEM. Comparisons were performed with t-tests (2 groups) or ANOVA (multiple groups); ns: non-significant; *p<0.05, **p<0.01, ***p<0.001. Data combined from three independent experiments unless otherwise stated.
Extended Data Figure 10
a-b, Area of SI (a) and LI (b) WT B6 organoids cultured +/− rhIL-22 dimer/Fc molecule F-652; SI: n=37 (0 ng/ml), n=60 (0.1 ng/ml), and n=41 (1 ng/ml) organoids/group combined from three experiments; LI: n=137 (0 ng/ml), n=83 (0.1 ng/ml), and n=132 (1 ng/ml) organoids/group combined from two experiments; ANOVA. c-d, Organoid efficiency relative to control in cultures of (c) B6 SI organoids (n=4 wells/group combined from two experiments) and (d) B6 LI organoids (n=3 wells/group; one of two experiments) treated with different concentrations of recombinant human F-652; ANOVA. e-f, B6 Lgr5-LacZ mice were treated with PBS or F-652 (100 μg/kg), administered subcutaneously on the day of total body irradiation (10-12 Gy) and again two days later; one of three experiments. e, Lgr5-LacZ+ crypt cells per SI circumference were evaluated at Day 3.5 post-irradiation (10 Gy); statistics based on n=11 independent sections (PBS-treated) vs. n=14 independent sections (F-652-treated) from irradiated mice; independent sections were derived from 3 mice per group; first dose of PBS or F-652 was administered four hours prior to irradiation; Mann-Whitney. f, Representative crypt base images 3.5 days after irradiation (10Gy). Arrows indicate Lgr5-LacZ+ crypt cells. Graphs demonstrate mean +/− SEM; ns: non-significant; *p<0.05, **p<0.01.
Figure 1
Figure 1. IL-22 increases growth of intestinal organoids
a, Size of SI organoids cultured in ENR with IL-23-containing cytokine cocktail +/− LPLs; n=62 (control), n=72 (IL-23), n=29 (WT LPLs), n=34 (Il22−/− LPLs) organoids/group; 1 of 2 experiments. b, Size of SI organoids cultured +/− ILC3s and anti-IL-22 neutralizing antibody; n=47 (control), n=55 (IL-23); n=43 (ILC3s); n=38 (anti-IL-22) organoids/group; 1 of 2 experiments. c, SI organoids, 7 days +/− rmIL-22 (5ng/ml). d-e, Size of organoids cultured +/− rmIL-22 for 7 days; n=114 (control), n=50 (0.1ng/ml), n=47 (1ng/ml), n=44 (5ng/ml) SI organoids/group (d); n=115 (control), n=61 (IL-22) LI organoids/group (e). f, New crypt formation (budding) of SI (day 4) and LI (day 7) organoids; n=6 mice/group. g, Size of human SI organoids cultured +/− rhIL-22 (10ng/ml) in standard expansion medium; n=38 (control), n=67 (IL-22) organoids/group. Bar graphs: mean+SEM; comparisons performed with t-tests (2 groups) or ANOVA (multiple groups); ns: non-significant; *p<0.05, **p<0.01, ***p<0.001. Data combined from at least three independent experiments unless otherwise stated.
Figure 2
Figure 2. IL-22 activates organoid STAT3 signaling and augments ISC regeneration
a, SI organoid size, 4 days +/− Stattic; n=174 (control), n=134 (20μm), n=102 (50μm) organoids/group. b Crypt pStat westerns after 30 minutes rmIL22 (5ng/ml) +/− Stattic; 1 of 3 experiments. c, Size of day 7 WT and Stat1−/− SI organoids +/−rmIL-22 (5ng/ml); n=821 (WT), n=503 (WT+IL-22), n=432 (Stat1−/−), n=269 (Stat1−/−+IL-22) organoids/group. d, Day 5 Stat3fl/fl SI organoids cultured with adeno-Cre +/− rmIL-22 (5ng/ml); numbers/well, n=6 wells/group; size, n=253 (WT), n=49 (WT+IL-22), n=38 (Stat3fl/fl), n=38 (Stat3fl/fl+IL-22) organoids/group; images representative of three experiments. e, GSEA of ISC signature genes in WT vs. Stat3fl/fl;Villin-Cre (Stat3ΔIEC) mice with DSS colitis; one analysis, nominal p-value shown. f-g, Organoids from sorted SI Lgr5-GFP+ ISCs cultured +/− rmIL-22 (1ng/ml). f, Organoid budding, percentage of total organoids/well (day 4, n=11 wells/group). Representative images of early budding indicate: *early organoid without budding; polarization prior to budding; budding at site of polarization. Scale bar: 50μm. g, Organoid area (day 13), n=54 organoids/group. h, Cell cycle FACS of SI organoid cells cultured +/− rmIL-22 (5ng/ml); n=7 mice/group. i, FACS analysis of Lgr5-GFPhigh ISCs in organoids cultured +/− rmIL-22; n=6 mice/group. j, Organoid expansion with serial passaging +/−rmIL-22 (1ng/ml); one of two experiments. Bar graphs: mean+SEM; comparisons performed with t-tests (2 groups) or ANOVA (multiple groups); ns: non-significant; *p<0.05, **p<0.01, ***p<0.001. Data combined from at least two independent experiments unless otherwise stated. For western blot source data, see Supplementary Figure 1.
Figure 3
Figure 3. IL-22 reduces intestinal pathology and increases ISC recovery after in vivo tissue damage
LPB6 BMT; recipients treated daily with PBS or 4μg rmIL-22 IP starting day 7 post-BMT. a, Intestinal GVHD histopathology score three weeks post-BMT; n=10 (TCD BM Only), n=9 (BM+T+PBS), n=8 (BM+T+IL-22) mice/group; Kruskal-Wallis analysis. b, qPCR of Reg3b and Reg3g in SI tissue three weeks post-BMT; n=9 (PBS) and n=10 (IL-22) mice/group; Mann-Whitney analysis. c-d, B6 Lgr5-LacZ recipients. c, SI ISC frequency three weeks post-BMT; Kruskal-Wallis analysis of n=8 (TCD BM only), n=20 (BM+T+PBS), or n=20 (BM+T+IL-22) independent sections (4 sections/recipient from 2-5 mice/group); one of two experiments. d, Crypt and TA heights three weeks post-BMT, representative images on right; t-test analyses of n=285 (PBS) vs. n=324 (IL-22) crypts and n=168 (PBS) vs. n=224 (IL-22) TA compartments (1 section/mouse, >10 mice/group). e, SI lysozyme+ Paneth cell frequency; Kruskal-Wallis analysis of n=73 (TCD BM only), n=89 (BM+T+PBS), and n=88 (BM+T+IL-22) crypts (5-8 mice/group). Bar graphs: mean+SEM; ns: non-significant; *p<0.05, **p<0.01, ***p<0.001. Data combined from at least two independent experiments unless otherwise stated.
Figure 4
Figure 4. IL-22 directly promotes ISC-dependent epithelial regeneration
a, Immunofluorescent staining of IL-22Rα1, GFP, and lysozyme in SI sections from Lgr5-GFP mice; green arrows, Lgr5-GFP+ ISCs; white arrows; lysozyme+ Paneth cells (PCs). b-c, Phosflow analysis of Lgr5-GFP+ SI crypt cells after 30 minutes +/− rmIL-22 (20ng/ml). b, pStat3 histogram; representative of four experiments. c, pStat median fluorescence intensity (MFI) and percent+; n=3 mice/group; representative of two experiments. d, Size of WT and Lgr5-DTR day 5 SI organoids cultured with DT (1ng/μl) to deplete Lgr5+ cells +/− rmIL-22 (5ng/ml); one of three experiments; n=65 (WT), n=25 (WT+DT), n=28 (DTR+IL-22), n=18 (DTR+DT), n=40 (DTR+DT+IL-22) organoids/group. e-f, Paneth cell-deficient Atoh1ΔIEC SI organoids cultured in Wnt3-supplemented ENR +/− rmIL-22 (5ng/ml). e, Stat3 westerns after 30 minutes rmIL-22; one of four experiments. f, Day 7 organoid size; n=466 (WT), n=531 (WT+IL-22), n=197 (Atoh1ΔIEC), n=491 (Atoh1ΔIEC+IL-22) organoids/group. g-h, LPB6 BMT +/− F-652 (100μg/kg subcutaneous, every-other-day starting day 7 post-BMT, 10-week course); n=10 (TCD BM only), n=15 (BM+T+PBS), n=15 (BM+T+IL-22). g, Clinical signs of GVHD and area under the curve (AUC) analysis of GVHD scoring. h, Survival. Bar graphs: mean+SEM; comparisons performed with t-tests (2 groups), ANOVA (multiple groups), or Log-Rank analysis (h); ns: non-significant; *p<0.05, ***p< 0.001. Data combined from at least two independent experiments unless otherwise stated. For western blot source data, see Supplementary Figure 1.

Comment in

Similar articles

Cited by

References

    1. Barker N, et al. Identification of stem cells in small intestine and colon by marker gene Lgr5. Nature. 2007;449:1003–1007. - PubMed
    1. Sato T, et al. Paneth cells constitute the niche for Lgr5 stem cells in intestinal crypts. Nature. 2010;469:415–418. - PMC - PubMed
    1. Sonnenberg GF, Artis D. Innate lymphoid cells in the initiation, regulation and resolution of inflammation. Nat Med. 2015;21:698–708. - PMC - PubMed
    1. Dudakov JA, Hanash AM, van den Brink MR. Interleukin-22: immunobiology and pathology. Annu Rev Immunol. 2015;33:747–785. - PMC - PubMed
    1. Metcalfe C, Kljavin NM, Ybarra R, de Sauvage FJ. Lgr5+ stem cells are indispensable for radiation-induced intestinal regeneration. Cell Stem Cell. 2014;14:149–159. - PubMed

Publication types

MeSH terms