

Mammalian phylogenetic diversity-area relationships at a continental scale
- PMID: 26649401
- PMCID: PMC4678667
- DOI: 10.1890/14-1858.1
Mammalian phylogenetic diversity-area relationships at a continental scale
Abstract
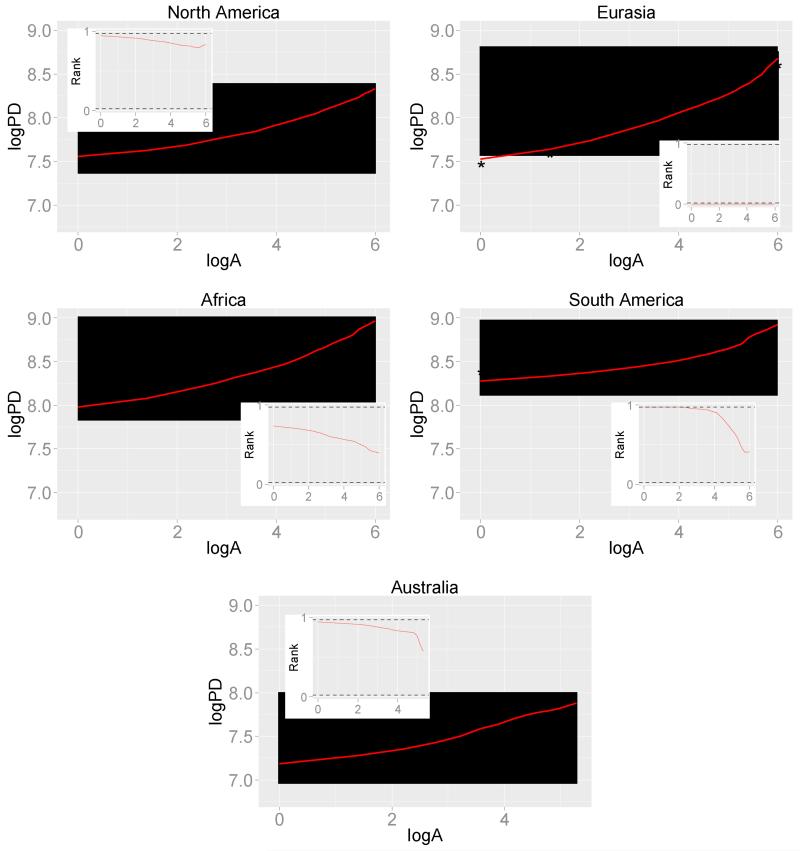
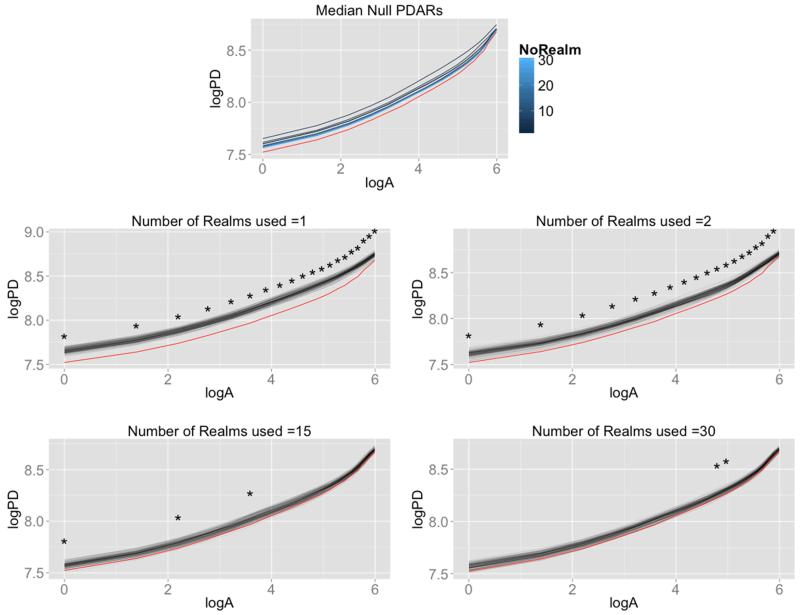
In analogy to the species-area relationship (SAR), one of the few laws in ecology, the phylogenetic diversity-area relationship (PDAR) describes the tendency of phylogenetic diversity (PD) to increase with area. Although investigating PDAR has the potential to unravel the underlying processes shaping assemblages across spatial scales and to predict PD loss through habitat reduction, it has been little investigated so far. Focusing on PD has noticeable advantages compared to species richness (SR), since PD also gives insights on processes such as speciation/extinction, assembly rules and ecosystem functioning. Here we investigate the universality and pervasiveness of the PDAR at continental scale using terrestrial mammals as study case. We define the relative robustness of PD (compared to SR) to habitat loss as the area between the standardized PDAR and standardized SAR (i.e., standardized by the diversity of the largest spatial window) divided by the area under the standardized SAR only. This metric quantifies the relative increase of PD robustness compared to SR robustness. We show that PD robustness is higher than SR robustness but that it varies among continents. We further use a null model approach to disentangle the relative effect of phylogenetic tree shape and nonrandom spatial distribution of evolutionary history on the PDAR. We find that, for most spatial scales and for all continents except Eurasia, PDARs are not different from expected by a model using only the observed SAR and the shape of the phylogenetic tree at continental scale. Interestingly, we detect a strong phylogenetic structure of the Eurasian PDAR that can be predicted by a model that specifically account for a finer biogeographical delineation of this continent. In conclusion, the relative robustness of PD to habitat loss compared to species richness is determined by the phylogenetic tree shape but also depends on the spatial structure of PD.
Figures


Similar articles
-
Multifaceted diversity-area relationships reveal global hotspots of mammalian species, trait and lineage diversity.Glob Ecol Biogeogr. 2014 Aug 1;23(8):836-847. doi: 10.1111/geb.12158. Glob Ecol Biogeogr. 2014. PMID: 25071413 Free PMC article.
-
Phylogenetic diversity as a window into the evolutionary and biogeographic histories of present-day richness gradients for mammals.Philos Trans R Soc Lond B Biol Sci. 2011 Aug 27;366(1576):2414-25. doi: 10.1098/rstb.2011.0058. Philos Trans R Soc Lond B Biol Sci. 2011. PMID: 21768156 Free PMC article. Review.
-
How global extinctions impact regional biodiversity in mammals.Biol Lett. 2012 Apr 23;8(2):222-5. doi: 10.1098/rsbl.2011.0752. Epub 2011 Sep 28. Biol Lett. 2012. PMID: 21957091 Free PMC article.
-
Measuring biodiversity to explain community assembly: a unified approach.Biol Rev Camb Philos Soc. 2011 Nov;86(4):792-812. doi: 10.1111/j.1469-185X.2010.00171.x. Epub 2010 Dec 14. Biol Rev Camb Philos Soc. 2011. PMID: 21155964 Review.
-
Evolutionary history and past climate change shape the distribution of genetic diversity in terrestrial mammals.Nat Commun. 2020 May 22;11(1):2557. doi: 10.1038/s41467-020-16449-5. Nat Commun. 2020. PMID: 32444801 Free PMC article.
Cited by
-
Variation in resting strategies across trophic levels and habitats in mammals.Ecol Evol. 2021 Oct 6;11(21):14405-14415. doi: 10.1002/ece3.8073. eCollection 2021 Nov. Ecol Evol. 2021. PMID: 34765115 Free PMC article. Review.
-
Linking Taxonomic, Phylogenetic and Functional Plant Diversity with Ecosystem Services of Cliffs and Screes in Greece.Plants (Basel). 2021 May 17;10(5):992. doi: 10.3390/plants10050992. Plants (Basel). 2021. PMID: 34067537 Free PMC article.
-
A complete time-calibrated multi-gene phylogeny of the European butterflies.Zookeys. 2020 Jun 4;938:97-124. doi: 10.3897/zookeys.938.50878. eCollection 2020. Zookeys. 2020. PMID: 32550787 Free PMC article.
References
-
- Araújo M, Rozenfeld A. The geographic scaling of biotic interactions. Ecography. 2014;37:406–415.
-
- Axelsen J, U Roll, L Stone, A Solow. Species-area relationships always overestimate extinction rates from habitat loss: comment. Ecology. 2013;94:761–763. - PubMed
-
- Belmaker J, Jetz W. Cross-scale variation in species richness–environment associations. Global Ecology and Biogeography. 2011
-
- Bininda-Emonds ORP, Cardillo M, Jones KE, MacPhee RDE, Beck RMD, Grenyer R, Price SA, Vos RA, Gittleman JL, Purvis A. The delayed rise of present-day mammals. Nature. 2007;446:507–12. - PubMed
Publication types
MeSH terms
Grants and funding
LinkOut - more resources
Full Text Sources
Research Materials
Miscellaneous