

NF-Y activates genes of metabolic pathways altered in cancer cells
- PMID: 26646448
- PMCID: PMC4811486
- DOI: 10.18632/oncotarget.6453
NF-Y activates genes of metabolic pathways altered in cancer cells
Abstract
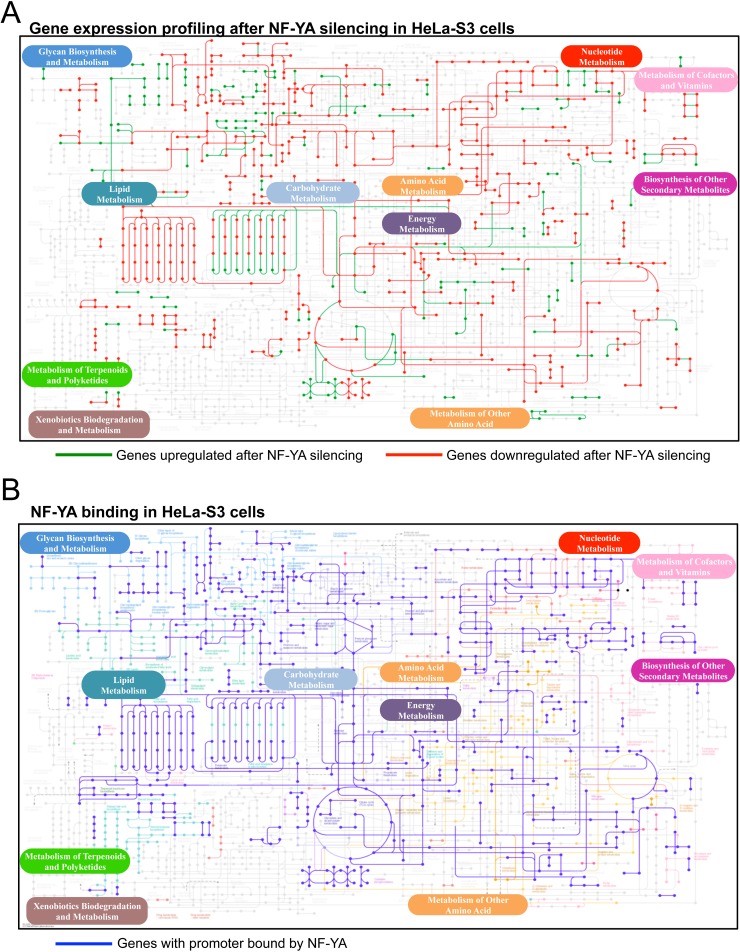
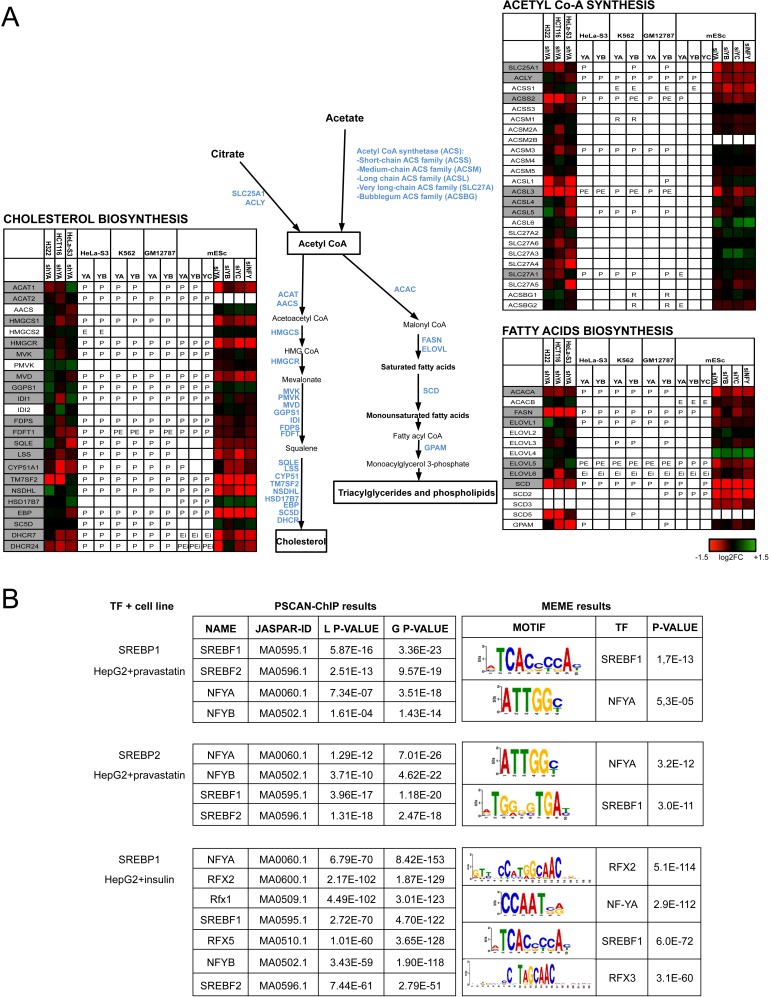
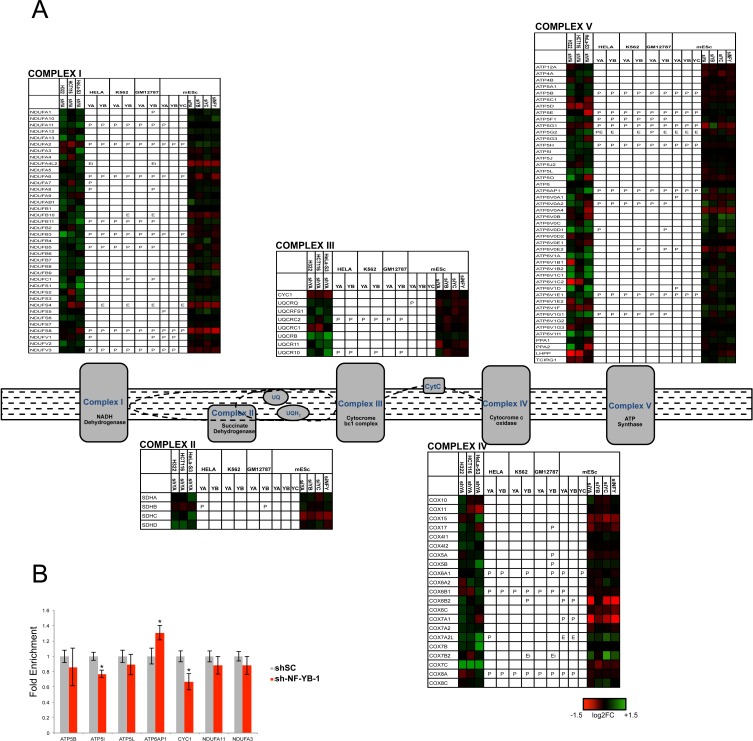
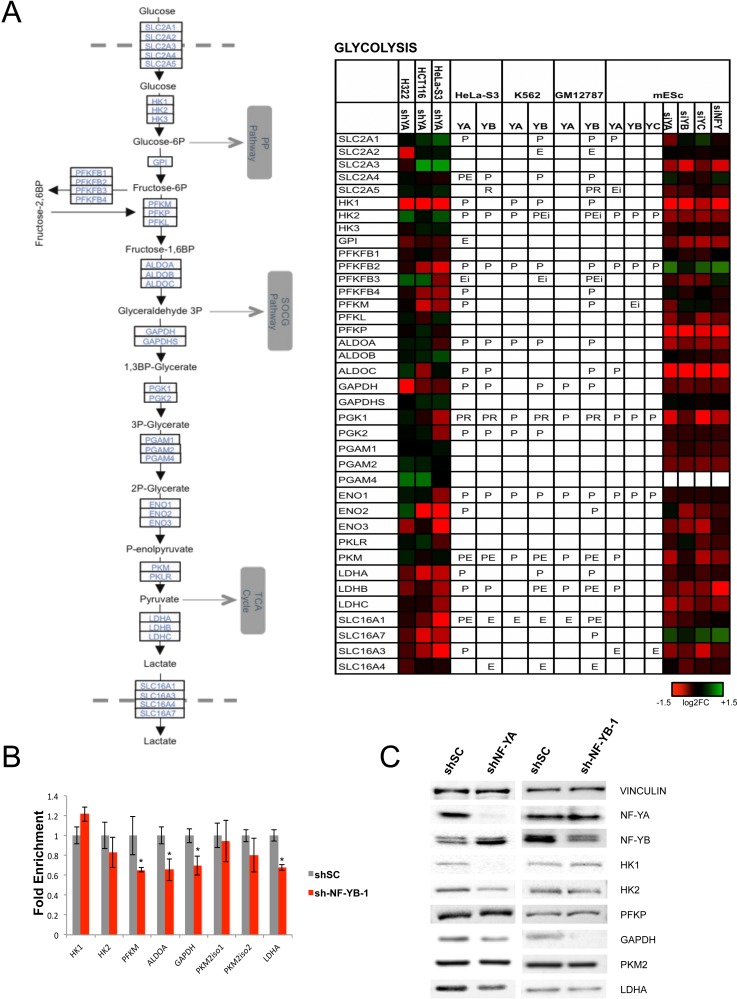
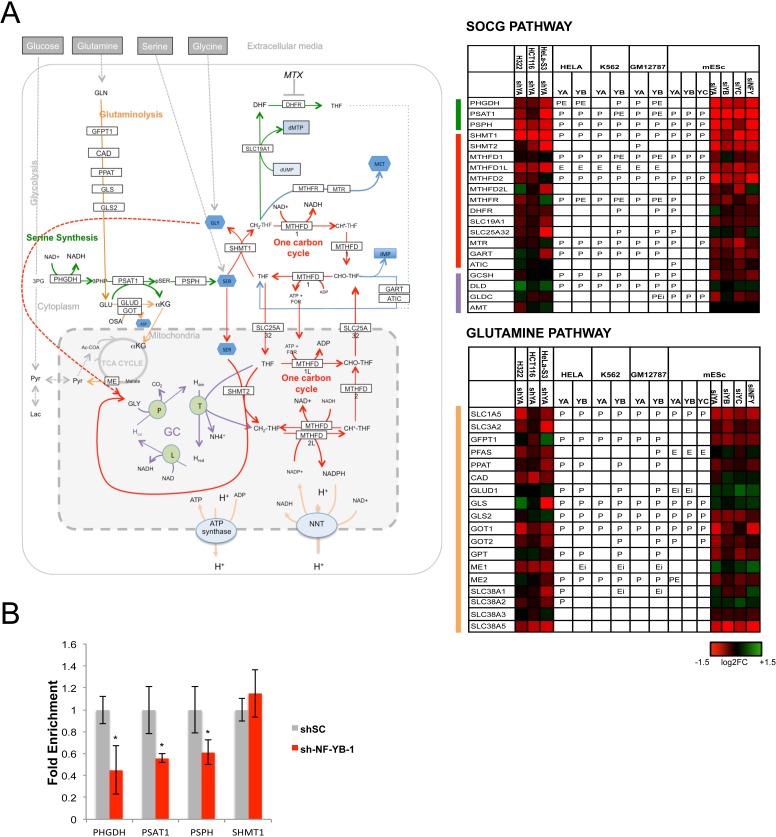
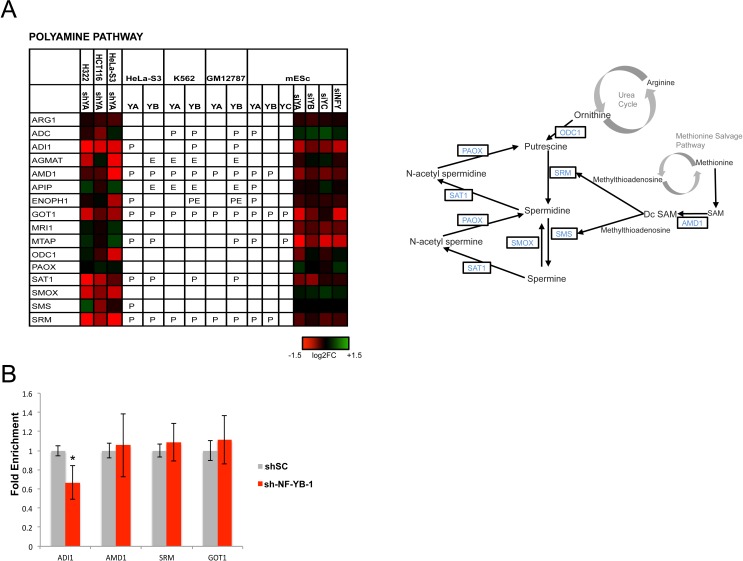
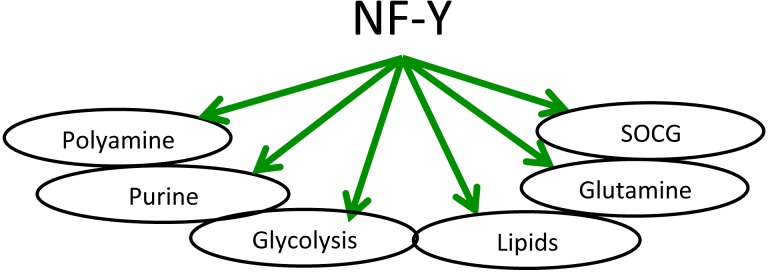
The trimeric transcription factor NF-Y binds to the CCAAT box, an element enriched in promoters of genes overexpressed in tumors. Previous studies on the NF-Y regulome identified the general term metabolism as significantly enriched. We dissect here in detail the targeting of metabolic genes by integrating analysis of NF-Y genomic binding and profilings after inactivation of NF-Y subunits in different cell types. NF-Y controls de novo biosynthetic pathways of lipids, teaming up with the master SREBPs regulators. It activates glycolytic genes, but, surprisingly, is neutral or represses mitochondrial respiratory genes. NF-Y targets the SOCG (Serine, One Carbon, Glycine) and Glutamine pathways, as well as genes involved in the biosynthesis of polyamines and purines. Specific cancer-driving nodes are generally under NF-Y control. Altogether, these data delineate a coherent strategy to promote expression of metabolic genes fuelling anaerobic energy production and other anabolic pathways commonly altered in cancer cells.
Keywords: NF-Y; SOCG pathway; cancer metabolism; glycolysis; transcription.
Conflict of interest statement
The authors declare that there are no conflicts of interest.
Figures
Similar articles
-
An autoregulatory loop controls the expression of the transcription factor NF-Y.Biochim Biophys Acta Gene Regul Mech. 2018 May;1861(5):509-518. doi: 10.1016/j.bbagrm.2018.02.008. Epub 2018 Mar 2. Biochim Biophys Acta Gene Regul Mech. 2018. PMID: 29505822
-
NF-YA Overexpression in Lung Cancer: LUAD.Genes (Basel). 2020 Feb 14;11(2):198. doi: 10.3390/genes11020198. Genes (Basel). 2020. PMID: 32075093 Free PMC article.
-
NF-Y subunits overexpression in gastric adenocarcinomas (STAD).Sci Rep. 2021 Dec 9;11(1):23764. doi: 10.1038/s41598-021-03027-y. Sci Rep. 2021. PMID: 34887475 Free PMC article.
-
NF-Y in cancer: Impact on cell transformation of a gene essential for proliferation.Biochim Biophys Acta Gene Regul Mech. 2017 May;1860(5):604-616. doi: 10.1016/j.bbagrm.2016.12.005. Epub 2016 Dec 9. Biochim Biophys Acta Gene Regul Mech. 2017. PMID: 27939755 Review.
-
Expression and function of NF-Y subunits in cancer.Biochim Biophys Acta Rev Cancer. 2024 Mar;1879(2):189082. doi: 10.1016/j.bbcan.2024.189082. Epub 2024 Feb 1. Biochim Biophys Acta Rev Cancer. 2024. PMID: 38309445 Review.
Cited by
-
Over-expression of NFYB affects stromal cells reprogramming and predicts worse survival in gastric cancer patients.Aging (Albany NY). 2022 Sep 22;14(19):7851-7865. doi: 10.18632/aging.204294. Epub 2022 Sep 22. Aging (Albany NY). 2022. PMID: 36152055 Free PMC article.
-
Role of oxidative stress in Retinitis pigmentosa: new involved pathways by an RNA-Seq analysis.Cell Cycle. 2019 Jan;18(1):84-104. doi: 10.1080/15384101.2018.1558873. Epub 2018 Dec 28. Cell Cycle. 2019. Retraction in: Cell Cycle. 2020 Jan;19(2):256. doi: 10.1080/15384101.2019.1702311. PMID: 30569795 Free PMC article. Retracted.
-
NF-Y Overexpression in Liver Hepatocellular Carcinoma (HCC).Int J Mol Sci. 2020 Dec 1;21(23):9157. doi: 10.3390/ijms21239157. Int J Mol Sci. 2020. PMID: 33271832 Free PMC article.
-
Enzymes in the Cholesterol Synthesis Pathway: Interactomics in the Cancer Context.Biomedicines. 2021 Jul 26;9(8):895. doi: 10.3390/biomedicines9080895. Biomedicines. 2021. PMID: 34440098 Free PMC article.
-
All-in-One digital microfluidics pipeline for proteomic sample preparation and analysis.Chem Sci. 2023 Feb 22;14(11):2887-2900. doi: 10.1039/d3sc00560g. eCollection 2023 Mar 15. Chem Sci. 2023. PMID: 36937585 Free PMC article.
References
-
- Nardini M, Gnesutta N, Donati G, Gatta R, Forni C, Fossati A, Vonrhein C, Moras D, Romier C, Bolognesi M, Mantovani R. Sequence-specific transcription factor NF-Y displays histone-like DNA binding and H2B-like ubiquitination. Cell. 2013;152:132–143. - PubMed
-
- Dolfini D, Zambelli F, Pavesi G, Mantovani R. A perspective of promoter architecture from the CCAAT box. Cell Cycle. 2009;8:4127–37. - PubMed
-
- Testa A, Donati G, Yan P, Romani F, Huang TH, Viganò MA, Mantovani R. Chromatin immunoprecipitation (ChIP) on chip experiments uncover a widespread distribution of NF-Y binding CCAAT sites outside of core promoters. J Biol Chem. 2005;280:13606–15. - PubMed
Publication types
MeSH terms
Substances
Grants and funding
LinkOut - more resources
Full Text Sources
Other Literature Sources
Molecular Biology Databases
