Comparative Study
. 2016 Feb 5;291(6):2812-28.
doi: 10.1074/jbc.M115.681130. Epub 2015 Dec 7.

Comparative Circadian Metabolomics Reveal Differential Effects of Nutritional Challenge in the Serum and Liver

Affiliations
Comparative Study

Comparative Circadian Metabolomics Reveal Differential Effects of Nutritional Challenge in the Serum and Liver

Serena Abbondante et al. J Biol Chem. .

Abstract

Diagnosis and therapeutic interventions in pathological conditions rely upon clinical monitoring of key metabolites in the serum. Recent studies show that a wide range of metabolic pathways are controlled by circadian rhythms whose oscillation is affected by nutritional challenges, underscoring the importance of assessing a temporal window for clinical testing and thereby questioning the accuracy of the reading of critical pathological markers in circulation. We have been interested in studying the communication between peripheral tissues under metabolic homeostasis perturbation. Here we present a comparative circadian metabolomic analysis on serum and liver in mice under high fat diet. Our data reveal that the nutritional challenge induces a loss of serum metabolite rhythmicity compared with liver, indicating a circadian misalignment between the tissues analyzed. Importantly, our results show that the levels of serum metabolites do not reflect the circadian liver metabolic signature or the effect of nutritional challenge. This notion reveals the possibility that misleading reads of metabolites in circulation may result in misdiagnosis and improper treatments. Our findings also demonstrate a tissue-specific and time-dependent disruption of metabolic homeostasis in response to altered nutrition.

Keywords: circadian rhythm; liver; metabolism; metabolomics; serum.


Figures

FIGURE 1.
FIGURE 1.
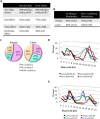
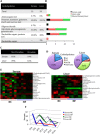
General loss of oscillation in serum metabolites after HFD compared with liver. A, comparison of the number of serum and liver metabolites affected by diet or time. B, comparison of oscillating and not oscillating metabolites in serum and liver. C, comparison of the numbers of oscillatory metabolites only in NC, only in HF, or in both NC and HF groups (BOTH) for serum and liver (p < 0.05, JTK_cycle, and n = 5 biological replicates). D, phase graphs of serum and liver metabolites that oscillate in both feeding conditions. E, phase graphs of serum and liver metabolites that oscillate only in the NC or HFD.
FIGURE 2.
FIGURE 2.
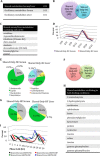
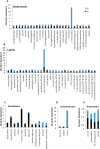
HFD affects leptin levels in serum and liver. Serum and liver levels of IL-6 (A), adiponectin (B), and leptin (C) within ZT4 and ZT16 in NC and HFD (asterisks, diet effect; number symbols, time effect; two-way analysis of variance; *, p < 0.05; **, p < 0.01; ###, p < 0.001, Tukey's post hoc test; error bars, S.E.; n = 3 biological replicates). D, immunoblotting analyses of phospho-AKT (Ser473), AKT, and GSK3β (Ser9) of NC and 10-week HFD livers at ZT8 and ZT20.
FIGURE 3.
FIGURE 3.
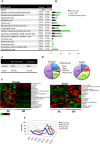
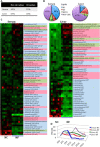
Phase alteration of shared serum and liver metabolites oscillating in both feeding conditions. A, number of shared metabolites oscillating in serum and liver. B, number of shared serum and liver metabolites oscillating only in NC. C, shared metabolites oscillating only in the NC conditions in both tissues. D, phase profiles for shared metabolites oscillating only in NC conditions in serum and liver. E, differences in metabolite composition between shared serum and liver metabolites that oscillate only in the NC conditions. F, number of shared serum and liver metabolites oscillating only in the HFD condition. G, differences in metabolite composition in shared serum and liver metabolites that oscillate only under HFD. H, shared metabolites oscillating in both feeding conditions. I, phase graphs of serum and liver metabolites that oscillate in common in under both feeding conditions (BOTH). Black line, shared serum metabolites that oscillate in the NC subset of the both category (i.e. oscillating under both feeding conditions but considering only NC conditions). Red line, shared serum metabolites oscillating in the HFD subset of the both category. Green line, shared liver metabolites oscillating in the NC subset of the both category. Blue line, shared liver metabolites in the HFD subset of the both category.
FIGURE 4.
FIGURE 4.
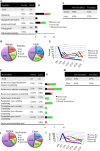
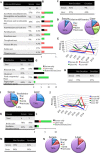
Loss of oscillation in serum amino acid metabolites after HFD compared with the liver. A, amino acid metabolite composition in serum and liver. B, differences in amino acid metabolite composition between serum and liver. Black bars, number of metabolites identified only in serum. Red bars, number of metabolites identified only in the liver. Green bars, number of metabolites shared between serum and liver. C, number of amino acid metabolites oscillating or not oscillating in serum and liver. D, comparison of the numbers of oscillatory amino acid metabolites only in NC, only in HFD, or in both NC and HF groups for serum and liver (p < 0.05, JTK_cycle, and n = 5 biological replicates). E, heat maps of select metabolites in the serum and liver of animals on NC or HFD. F, phase profiles for amino acid metabolites oscillating for each feeding condition in serum and liver. The percentage of oscillatory metabolites that peak at a specific ZT in NC and HFD compared with the total number of oscillatory metabolites in that metabolic pathway is plotted.
FIGURE 5.
FIGURE 5.
Gain of oscillation in peptide metabolites in serum under HFD conditions compared with liver (A–E) and gain of oscillation in nucleotide metabolites in serum in HFD compared with liver (F–J). A, peptide metabolite composition in serum and liver. B, differences in peptide metabolite composition between serum and liver. Black bars, number of metabolites identified only in serum. Red bars, number of metabolites identified only in the liver. Green bars, number of common (shared) metabolites between serum and liver. C, number of peptide metabolites oscillating or not oscillating in serum and liver. D, comparison of the numbers of oscillatory peptide metabolites only in NC, only in HF, or in both NC and HF groups for serum and liver (p < 0.05, JTK_cycle, and n = 5 biological replicates). E, phase profiles for peptide metabolites oscillating for each feeding condition in serum and liver. The percentage of oscillatory metabolites that peak at a specific ZT in NC and HFD compared with the total number of oscillatory metabolites in that metabolic pathway is plotted. F, nucleotide metabolite composition in serum and liver. G, differences in nucleotide metabolite composition between serum and liver. Black bars, number of metabolites identified only in serum. Red bars, number of metabolites identified only in the liver. Green bars, number of common (shared) metabolites between serum and liver. H, comparison of number of nucleotide metabolites oscillating or not oscillating in serum and liver. I, comparison of the numbers of oscillatory nucleotide metabolites only in NC, only in HF, or in both NC and HF groups for serum and liver (p < 0.05, JTK_cycle, and n = 5 biological replicates). J, phase profiles for nucleotide metabolites oscillating for each feeding condition in serum and liver. The percentage of oscillatory metabolites that peak at a specific ZT in NC and HFD compared with the total number of oscillatory metabolites in that metabolic pathway is plotted.
FIGURE 6.
FIGURE 6.
Loss of oscillation in serum carbohydrate metabolites compared with liver in HFD. A, carbohydrate metabolite composition in serum and liver. B, differences in carbohydrate metabolite composition between serum and liver. Black bars, number of metabolites identified only in serum. Red bars, number of metabolites identified only in the liver. Green bars, number of common (shared) metabolites between serum and liver. C, comparison of carbohydrate metabolites oscillating or not oscillating in serum and liver. D, comparison of the numbers of oscillatory carbohydrate metabolites only in NC, only in HF, or in both NC and HF groups for serum and liver (p < 0.05, JTK_cycle, and n = 5 biological replicates). E, heat maps of select shared carbohydrate metabolites in the liver and serum under NC and HFD conditions. F, peak profiles for carbohydrate metabolites oscillating for each feeding condition in serum and liver. The percentage of oscillatory metabolites that peak at a specific ZT in NC and HFD compared with the total number of oscillatory metabolites in that metabolic pathway is plotted.
FIGURE 7.
FIGURE 7.
Gain of cycling serum lipid metabolites compared with liver. A, percentage of lipid metabolites circadian or not circadian under normal chow or high fat diet conditions. B, comparison of the numbers of oscillatory lipid metabolites only in NC, only in HF, or in both NC and HFD groups for serum and liver (p < 0.05, JTK_cycle, and n = 5 biological replicates). C, heat maps of lipid metabolites oscillating and not oscillating in serum (left map) and liver (right map) samples under NC and HFD. Shown are lysolipids (light blue), long-chain fatty acids (pink), and essential fatty acids (green). D, phase profiles for lipid metabolites oscillating for each feeding condition in serum and liver. The percentage of oscillatory metabolites that peak at a specific ZT in NC and HFD compared with the total number of oscillatory metabolites in that metabolic pathway is plotted.
FIGURE 8.
FIGURE 8.
Loss of oscillation in cofactor and vitamin metabolites in serum in HFD compared with liver (A–E), gain of oscillation in xenobiotic metabolites in serum in NC and HFD compared with liver (F–J), and loss of oscillation in serum and liver of energy-related metabolites (K–N). A, cofactors and vitamin metabolite composition in serum and liver. B, differences in cofactors and vitamin metabolite composition between serum and liver. Black bars, number of metabolites identified only in serum. Red bars, number of metabolites identified only in the liver. Green bars, number of metabolites shared between serum and liver. C, number of cofactor and vitamin-related metabolites oscillating or not oscillating in serum and liver. D, comparison of the numbers of oscillatory cofactors and vitamin metabolites only in NC, only in HF, or in both NC and HF groups for serum and liver (p < 0.05, JTK_cycle, and n = 5 biological replicates). E, phase profiles for cofactor and vitamin metabolites oscillating for each feeding condition in serum and liver. The percentage of oscillatory metabolites that peak at a specific ZT in NC and HFD compared with the total number of oscillatory metabolites in that metabolic pathway is plotted. F, xenobiotic metabolite composition in serum and liver. G, differences in xenobiotic metabolites composition between serum and liver. Black bars, number of metabolites identified only in serum. Red bars, number of metabolites identified only in the liver. Green bars, number of metabolites shared between serum and liver. H, number of xenobiotic metabolites oscillating or not oscillating in serum and liver. I, comparison of the numbers of oscillatory xenobiotic metabolites only in NC, only in HF, or in both NC and HF groups for serum and liver (p < 0.05, JTK_cycle, and n = 5 biological replicates). J, phase profiles for xenobiotic metabolites oscillating for each feeding condition in serum and liver. The percentage of oscillatory metabolites that peak at a specific ZT in NC and HFD compared with the total number of oscillatory metabolites in that metabolic pathway is plotted. K, energy metabolite composition in serum and liver. L, differences in energy metabolite composition between serum and liver. Black bars, number of metabolites identified only in serum. Red bars, number of metabolites identified only in the liver. Green bars, number of metabolites shared between serum and liver. M, comparison of the numbers of energy metabolites oscillating or not oscillating in serum and liver. N, comparison of the numbers of oscillatory energy metabolites only in NC, only in HF, or in both NC and HF groups for serum and liver (p < 0.05, JTK_cycle, and n = 5 biological replicates).
FIGURE 9.
FIGURE 9.
HFD affects the absolute abundance of several metabolites in serum. Shown is a representation of serum metabolites found to be affected by diet (p < 0.05).

Similar articles

Cited by

References

    1. Adamovich Y., Rousso-Noori L., Zwighaft Z., Neufeld-Cohen A., Golik M., Kraut-Cohen J., Wang M., Han X., and Asher G. (2014) Circadian clocks and feeding time regulate the oscillations and levels of hepatic triglycerides. Cell Metab. 19, 319–330 - PMC - PubMed
    1. Huang W., Ramsey K. M., Marcheva B., and Bass J. (2011) Circadian rhythms, sleep, and metabolism. J. Clin. Invest. 121, 2133–2141 - PMC - PubMed
    1. Sahar S., and Sassone-Corsi P. (2012) Regulation of metabolism: the circadian clock dictates the time. Trends Endocrinol. Metab. 23, 1–8 - PMC - PubMed
    1. Dibner C., Schibler U., and Albrecht U. (2010) The mammalian circadian timing system: organization and coordination of central and peripheral clocks. Annu. Rev. Physiol. 72, 517–549 - PubMed
    1. Nakahata Y., Kaluzova M., Grimaldi B., Sahar S., Hirayama J., Chen D., Guarente L. P., and Sassone-Corsi P. (2008) The NAD+-dependent deacetylase SIRT1 modulates CLOCK-mediated chromatin remodeling and circadian control. Cell 134, 329–340 - PMC - PubMed

Publication types