. 2015 Dec 4:5:17527.
doi: 10.1038/srep17527.

Distinct predictive performance of Rac1 and Cdc42 in cell migration

Affiliations

Distinct predictive performance of Rac1 and Cdc42 in cell migration

Masataka Yamao et al. Sci Rep. .

Abstract

We propose a new computation-based approach for elucidating how signaling molecules are decoded in cell migration. In this approach, we performed FRET time-lapse imaging of Rac1 and Cdc42, members of Rho GTPases which are responsible for cell motility, and quantitatively identified the response functions that describe the conversion from the molecular activities to the morphological changes. Based on the identified response functions, we clarified the profiles of how the morphology spatiotemporally changes in response to local and transient activation of Rac1 and Cdc42, and found that Rac1 and Cdc42 activation triggers laterally propagating membrane protrusion. The response functions were also endowed with property of differentiator, which is beneficial for maintaining sensitivity under adaptation to the mean level of input. Using the response function, we could predict the morphological change from molecular activity, and its predictive performance provides a new quantitative measure of how much the Rho GTPases participate in the cell migration. Interestingly, we discovered distinct predictive performance of Rac1 and Cdc42 depending on the migration modes, indicating that Rac1 and Cdc42 contribute to persistent and random migration, respectively. Thus, our proposed predictive approach enabled us to uncover the hidden information processing rules of Rho GTPases in the cell migration.


Figures

Figure 1
Figure 1. Quantification of cell edge displacement and Rho GTPase activity.
(a) Snapshot images showing the spontaneous migration of HT-1080 cells expressing the biosensors Raichu–Cdc42 (left) and Raichu–Rac1 (right). See also Supplementary Movies 1,2. FRET/CFP ratio ranges in intensity modulated display (IMD) mode, which associates color hue with emission ratio value and the intensity of each hue with the source image brightness, are shown at the right of each image. (b) Migrating HT1080 cells are tracked based on the CFP image. Different-colored polygons (connected markers) indicate the time-series of the tracked cellular boundaries (from cyan to red). The vertices (virtual markers) are placed in an equidistant manner along the perimeter at each time. Edge displacement is quantified based on the length of the connected link between the vertices at serial time frames. (c,d) Quantified edge displacement (elongation/retraction) (b) and Cdc42 activity, i.e., the FRET/CFP ratio value (c) at each virtual marker is mapped onto a two-dimensional heat map consisting of time (abscissa) and marker index (ordinate). (e) The spatiotemporal cross-correlation function between the edge displacement and Cdc42 activity of a specific cell (the same one as in (c,d)) is plotted. Abscissa and ordinate indicate the shifts in time and marker indices, respectively. (f) The temporal cross-correlation functions between edge displacement and Cdc42 activity are plotted with the time shift. The blue line was calculated by (c) and (d). In each sample (a single black line), the local shape change precedes the molecular activity change. The red line shows the mean cross-correlation function of all of the cells (N = 11).
Figure 2
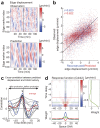
Figure 2. Prediction of elongation/retraction based on Cdc42 activity via the response function.
(a) Prediction of the local morphological change based on Cdc42 activity. The upper and lower panels show the local edge displacement (same as Fig. 1c) obtained in an experiment and the local edge displacement reconstructed/predicted via the response function, respectively. The left-hand side of the vertical black line in the upper panel was used as the training data to estimate the response function, and hence the right-hand side was never used for the training. For validation, the left-hand and right-hand sides in the lower panel were reconstructed and predicted using the estimated response function, respectively. (b) The reconstructed and predicted edge displacements were strongly correlated with the observed displacements. Each dot represents the relationship between the reconstruction/prediction and an observation of each edge displacement, and the red and blue colors correspond to reconstruction and prediction, respectively. (c) The temporal cross-correlation functions between the predicted edge displacement and the Cdc42 activity are plotted with the time shift as in Fig. 1f. (d) A response function of Cdc42 is plotted on a two-dimensional plane (upper left panel) coordinated by a space shift and a time delay. Each colored-line in the upper right and lower panels represents a cross-section of the spatiotemporal response function (upper left panel) along the straight line with the corresponding color.
Figure 3
Figure 3. Cross-cellular analysis of response functions.
(a) Schematic of the similarity analysis of the response functions of Rac1 (middle panel) and Cdc42 (right panel) between different cells. Both the ordinate and abscissa indicate indices of cells so that each matrix element represents the cosine similarity in the response functions between the pair of cells specified by the element’s indices. (b) Predictability of response functions of Rac1 (middle panel) and Cdc42 (right panel) between different cells. Each matrix element represents the correlation between the observed edge displacement in a specific cell (‘target cell’) and the predicted edge displacement in the target cell decoded based on the response function of another cell (‘reference cell’). The ordinate and abscissa denote the indices of the target cell and the reference cell, respectively. (c) Relationship between the mode of the cell migration and the contributions of Rac1 (middle panel) and Cdc42 (right panel) to the morphological change. The contributions of Rac1 and Cdc42 were evaluated via predictability, which corresponds to the diagonal elements in (b). Each dot represents a single cell, where cell numbers with blue and red dots correspond to those in (b), respectively. The migration mode was evaluated via the lateral propagation speed of the edge displacement, which was quantified based on the speed of the wave propagation, which is indicated with a red dashed line in the spatiotemporal auto-correlation function (left insets).
Figure 4
Figure 4. Predictions of macroscopic cell migration based on Cdc42 activity.
Macroscopic cell migration is reconstructed/predicted from Rac1 (a,b) and Cdc42 (c,d) activity. Migration direction (a,c) and migration speed (b,d) are quantified as the direction and speed of the movement of cellular centroid, respectively. The time-series were divided into two parts; the first half and last half of the data were used for estimating the response function and testing it, respectively. The blue and red lines in each panel show observations and reconstructions (before the black dotted vertical line, first half of the data) or predictions (after the black dotted vertical line, last half of the data), respectively. r is the correlation coefficient between the observations and reconstructions/predictions (see Materials and Methods) over the entire time series.
Figure 5
Figure 5. Models of cell migration.
(a) A model of signal transmission from Rho GTPases to edge displacement in order to explain Rho GTPases activation following membrane protrusion. The response function (middle panel) processes an input signal (Rac1/Cdc42 in the left panel) and generates an output (edge displacement in the right panel). The red and blue curves in the middle panel correspond to the response functions with leaky and differentiating properties, respectively. Note that the estimated response functions possess the differentiating property (right inset in Fig. 2d). In the right panel, output signal through the response function with differentiating property indicated by the red line is followed by input signal, which is plotted by the thin black curve for comparison. (b) A model of migration modes depending on the balance between the activities of Rac1 and Cdc42. In persistently and randomly migrating cells, Rac1 and Cdc42 have great contributions to the cell migration, respectively, which can be evaluated in terms of the predictability measure (Fig. 3c). (c) A tug-of-war model of macroscopic cell migration. The angle and speed of the cellular migration indicated by the red vector can be predicted by summation like tug-of-war of the distributed driving factors of the locally extended membrane indicated by the black arrows (Fig. 4). The driving factors are predicted by Rac1/Cdc42 through the response function (Fig. 2a).

Similar articles

Cited by

References

    1. Itoh R. E. et al. Activation of rac and cdc42 video imaged by fluorescent resonance energy transfer-based single-molecule probes in the membrane of living cells. Mol Cell Biol 22, 6582–6591 (2002). - PMC - PubMed
    1. Kurokawa K. & Matsuda M. Localized RhoA activation as a requirement for the induction of membrane ruffling. Mol Biol Cell 16, 4294–4303 (2005). - PMC - PubMed
    1. Nishioka T. et al. Rapid turnover rate of phosphoinositides at the front of migrating MDCK cells. Mol Biol Cell 19, 4213–4223 (2008). - PMC - PubMed
    1. Lauffenburger D. A. & Horwitz A. F. Cell migration: a physically integrated molecular process. Cell 84, 359–369 (1996). - PubMed
    1. Nonaka S., Naoki H. & Ishii S. A multiphysical model of cell migration integrating reaction-diffusion, membrane and cytoskeleton. Neural Netw 24, 979–989 (2011). - PubMed

Publication types

MeSH terms