. 2015 Dec 3:6:10068.
doi: 10.1038/ncomms10068.

PTEN deficiency reprogrammes human neural stem cells towards a glioblastoma stem cell-like phenotype

Affiliations

PTEN deficiency reprogrammes human neural stem cells towards a glioblastoma stem cell-like phenotype

Shunlei Duan et al. Nat Commun. .

Abstract

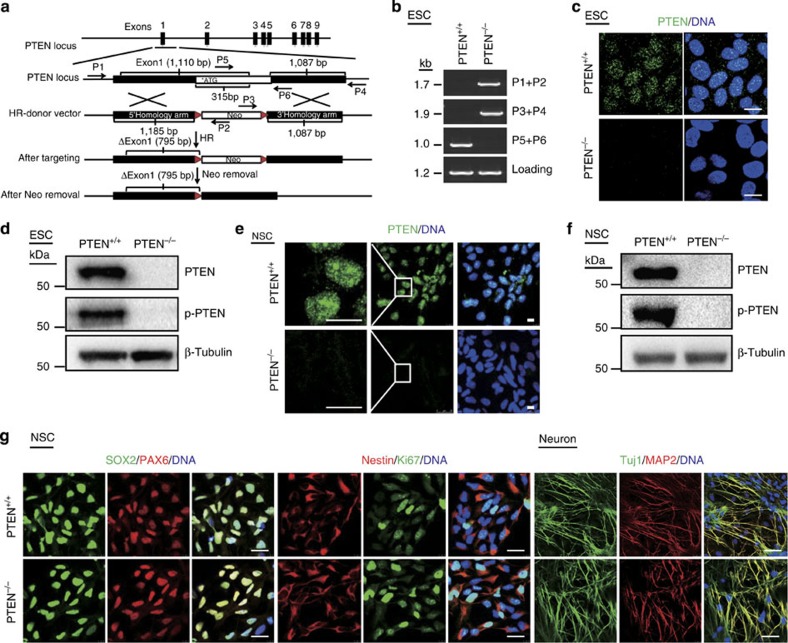
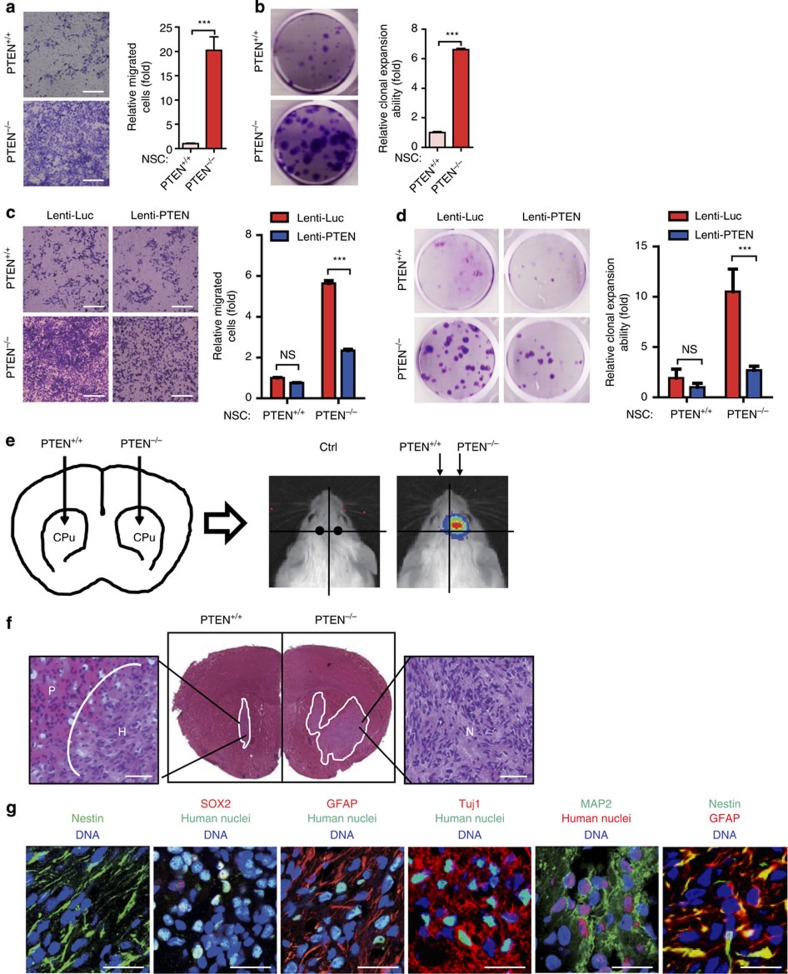
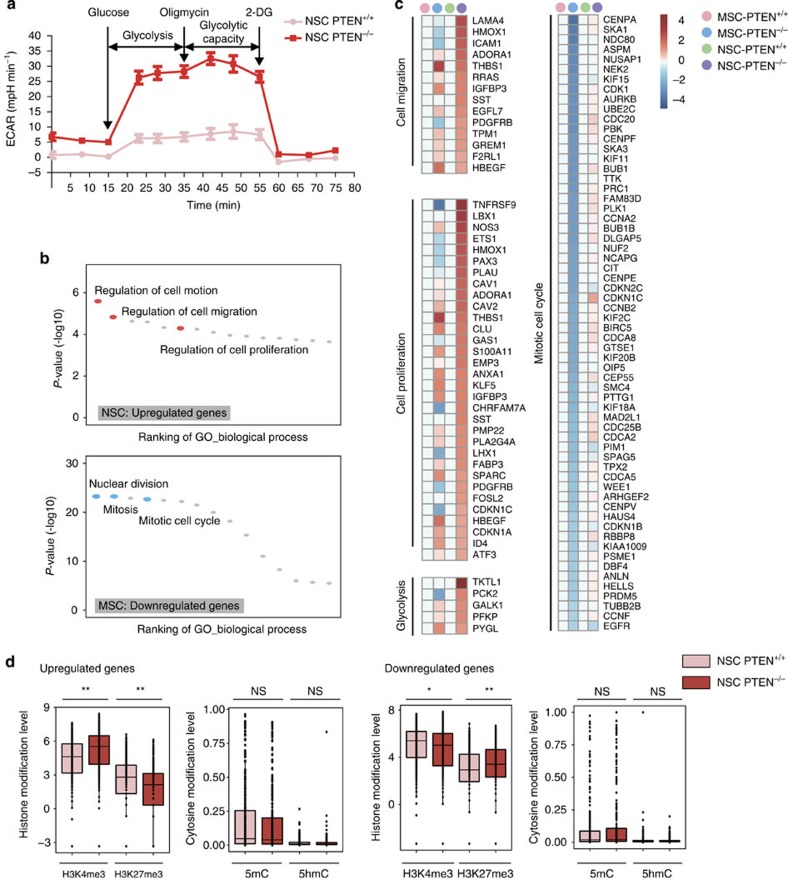
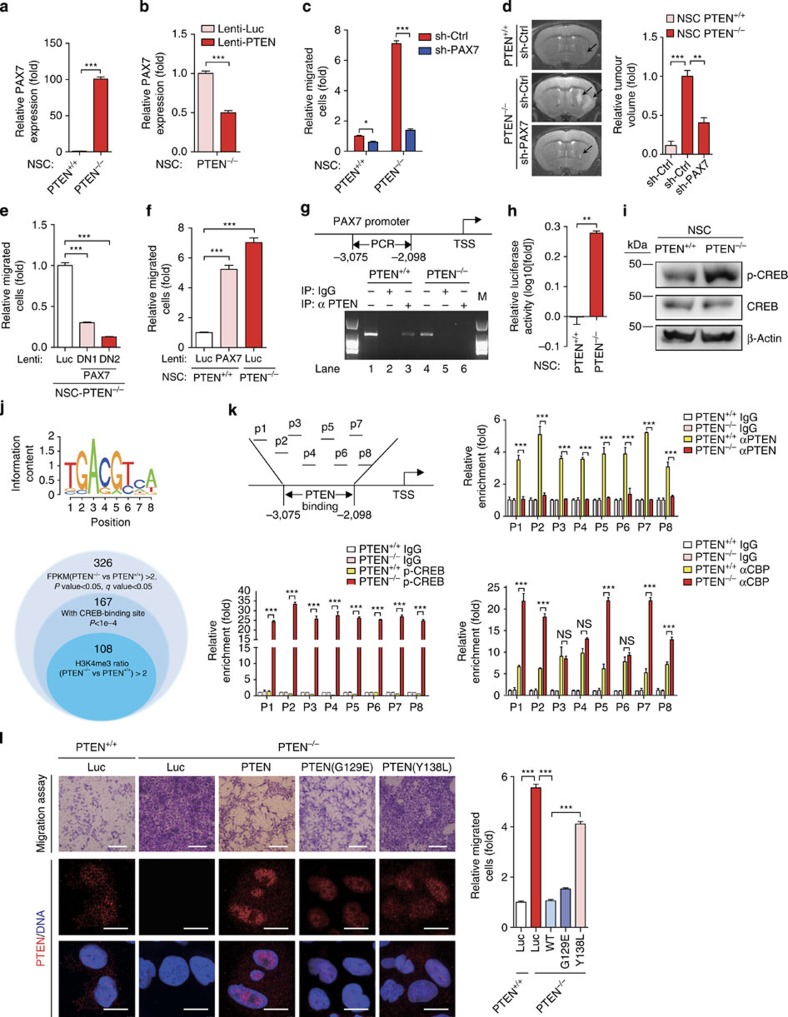
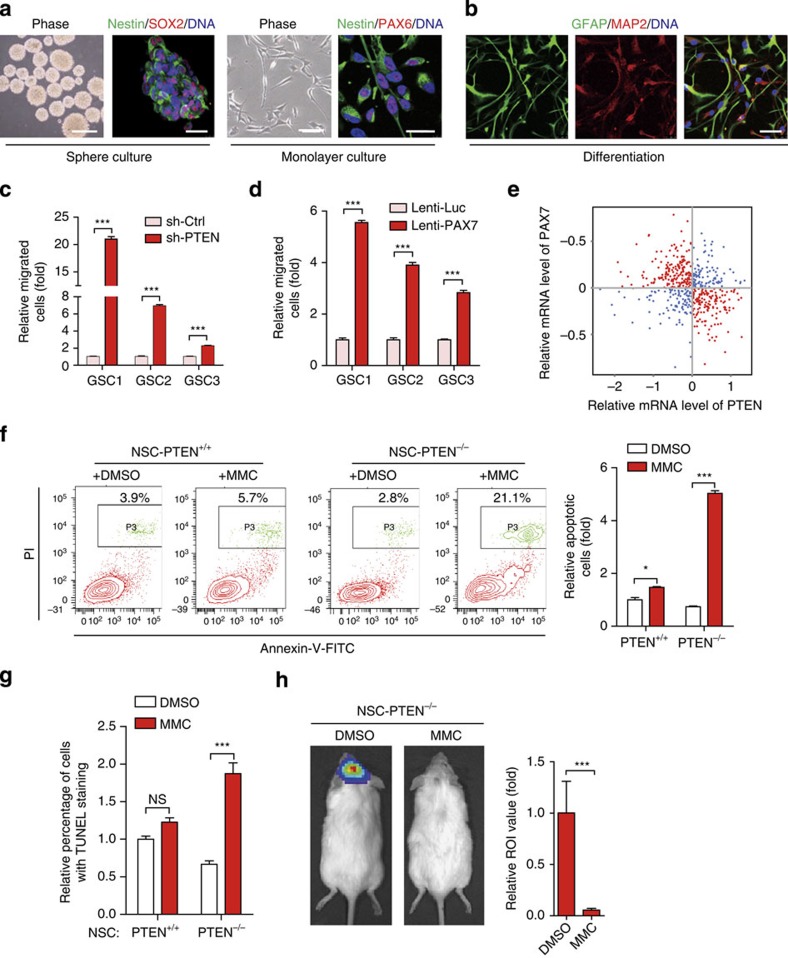
PTEN is a tumour suppressor frequently mutated in many types of cancers. Here we show that targeted disruption of PTEN leads to neoplastic transformation of human neural stem cells (NSCs), but not mesenchymal stem cells. PTEN-deficient NSCs display neoplasm-associated metabolic and gene expression profiles and generate intracranial tumours in immunodeficient mice. PTEN is localized to the nucleus in NSCs, binds to the PAX7 promoter through association with cAMP responsive element binding protein 1 (CREB)/CREB binding protein (CBP) and inhibits PAX7 transcription. PTEN deficiency leads to the upregulation of PAX7, which in turn promotes oncogenic transformation of NSCs and instates 'aggressiveness' in human glioblastoma stem cells. In a large clinical database, we find increased PAX7 levels in PTEN-deficient glioblastoma. Furthermore, we identify that mitomycin C selectively triggers apoptosis in NSCs with PTEN deficiency. Together, we uncover a potential mechanism of how PTEN safeguards NSCs, and establish a cellular platform to identify factors involved in NSC transformation, potentially permitting personalized treatment of glioblastoma.


Figures

Figure 1
Figure 1. Generation and characterization of PTEN-deficient NSCs.
(a) Schematic representation of TALEN-based PTEN targeting strategy. Primers used for b are shown as arrows (P1–P6). The donor vector includes a neomycin-resistance cassette (Neo) allowing for positive selection. (b) PCR analysis of WT and PTEN−/− ESCs using primer pairs indicated (P1+P2: 1,744 bp; P3+P4: 1,872 bp; P5+P6: 1,035 bp). (c) Immunofluorescence analysis performed on WT and PTEN−/− ESCs with an anti-PTEN antibody. PTEN was absent in the PTEN−/− ESCs. Nuclei were stained with Hoechst 33342. Scale bars, 12.5 μm. (d) Immunoblotting verified the absence of PTEN protein in PTEN−/− ESCs with anti-PTEN and anti-phospho-PTEN (Ser380) antibodies. β-Tubulin was used as loading control. (e) Immunostaining of PTEN in WT and PTEN−/− NSCs with an anti-PTEN antibody. Scale bars, 10 μm. (f) Immunoblotting analysis of PTEN and phospho-PTEN in WT and PTEN−/− NSCs. (g) Immunostaining of neural progenitor- (left) and neuron- (right) specific markers in WT and PTEN−/− NSCs (left) and their neuronal derivatives (right). Scale bars, 25 μm (NSC) and 50 μm (neuron).
Figure 2
Figure 2. PTEN-deficient NSCs demonstrated neoplastic features in vitro and in vivo.
(a) Migration abilities of WT and PTEN−/− NSCs were evaluated by Transwell assays. Relative cell migration efficiency was determined. Data are shown as mean±s.e.m. n=3. ***P<0.001 (t-test). Scale bars, 1 mm. (b) Clonal expansion analysis in WT and PTEN−/− NSCs. Crystal violet staining-positive cells were calculated and presented as fold induction using Image J. Data are shown as mean±s.e.m. n=4. ***P<0.001 (t-test). (c) Cell migration analyses of NSCs transduced with a PTEN expression vector (Lenti-PTEN) or a control vector (Lenti-Luc). Data are shown as mean±s.e.m. n=6. ***P<0.001 (t-test); NS, not significant. Scale bars, 1 mm. (d) Clonal expansion analysis of NSCs transduced with Lenti-PTEN or Lenti-Luc. Data are shown as mean±s.e.m. n=3. ***P<0.001 (t-test); NS, not significant. (e) Representative photon flux images from the brain of NOD/SCID mice implanted with WT (left) and PTEN−/− (right) NSCs expressing luciferase (also see Supplementary Fig.6a for details). Images were taken 20 min after L-luciferin was injected intraperitoneally (i.p.). n=3. (f) H&E staining and photomicrograph of a section of entire brain showing dramatic neoplastic expansion of PTEN−/− NSCs relative to WT control (2 × 10⁶ cells per injection), 35 days after cells were injected into the contralateral corpus striatum. H represents residual human NSC graft without expansion, N represents neoplasm and P represents mouse brain parenchyma. Scale bars, 500 μm. (g) Immunostaining of brain sections described in f with antibodies against the indicated antigens. Human nuclei, human nucleus antigen. DNA was stained with Hoechst 33342. Scale bars, 25 μm.
Figure 3
Figure 3. Transcriptome and epigenome analyses in PTEN-deficient stem cells.
(a) Glycolysis flux analysis measured by extracellular acidification rates (ECARs) in PTEN+/+ and PTEN−/− NSCs. n=5. (b) GO biological process analysis of genes upregulated (q-value<0.05, FC[PTEN−/−/PTEN+/+]>2) after PTEN knockout in NSCs and genes downregulated (q-value<0.05, FC[PTEN−/−/PTEN+/+]<0.5) after PTEN knockout in MSCs. (c) Heat map displaying the upregulated genes (q-value<0.05, FC[PTEN−/−/PTEN+/+]>2) in PTEN-deficient NSCs (left) and the downregulated genes (q-value <0.05, FC[PTEN−/−/PTEN+/+]<0.5) in PTEN-deficient MSCs (right). The representative enriched GO terms of biological processes were shown at the left side of each panel. (d) Boxplots showing H3K4me3, H3K27me3, 5mC and 5hmC levels in the region of 1 kb upstream and 1 kb downstream of TSS of differentially expressed genes between PTEN−/− and WT NSCs including the upregulated genes (left panels, q-value<0.05, FC[PTEN−/−/PTEN+/+]>2; n=326) and downregulated genes (right panels, q-value <0.05, FC[PTEN−/−/PTEN+/+]<0.5; n=281). *P value <0.05 (Wilcoxon signed-rank test); **P value <0.01 (Wilcoxon signed-rank test); NS, not significant.
Figure 4
Figure 4. Transcriptional activation of PAX7 underlies oncogenic features in PTEN-deficient NSCs.
(a) RT–qPCR analyses of PAX7 expression in WT and PTEN−/− NSCs. n=3. ***P<0.001 (t-test). (b) RT–qPCR showing reduced transcripts of PAX7 in PTEN−/− NSCs transduced with lentivirus encoding PTEN. n=3. ***P<0.001 (t-test). (c) Cell migration analysis in WT and PTEN−/− NSCs transduced with control shRNA or PAX7 shRNA. n=5. *P<0.05 (t-test); and ***P<0.001 (t-test). (d) MRI analysis of intracranially implanted WT and PTEN−/− NSCs pre-transduced with control or PAX7 shRNA. Relative volumes of tumours are presented. n=4. **P<0.01 (t-test), and ***P<0.001 (t-test). (e) Cell migration analysis in PTEN−/− NSCs transduced with the lentiviral vector encoding dominant negative mutants of PAX7 (DN1: a.a.1–263; DN2: a.a.1–318) or a luciferase control (Luc). n=3. ***P<0.001 (t-test). (f) Cell migration analysis in WT NSCs transduced with the lentiviral vector encoding PAX7. n=3. ***P<0.001 (t-test). (g) ChIP-PCR showing the association of endogenous PTEN with PAX7 promoter in WT NSCs. The PAX7 promoter was amplified by PCR from either genomic DNA as input (lanes 1 and 4) or anti-PTEN immunoprecipitated DNA (lanes 3 and 6). (h) Luciferase reporter assay showed that the PTEN-docking DNA element described in g has a higher cis-activation ability when PTEN was depleted in NSCs. n=3. **P<0.01 (t-test). (i) Immunoblotting analysis of CREB and phospho-CREB (Ser133) expression in WT and PTEN−/− NSCs. β-Actin was used as loading control. (j) Upper panel: Identification of CRE-containing genes in the human genome by the FIMO software tool. Lower panel: Bioinformatic analysis predicated that 167 (51.2%) of 326 genes upregulated in PTEN−/− NSCs are potential CREB-targets. (k) ChIP-qPCR analysis for PTEN, p-CREB and CBP enrichment within the PTEN-docking DNA region at the PAX7 promoter in WT and PTEN−/− NSCs. P1–P8 indicate the different sub-regions. ***P<0.001 (t-test); NS, not significant. (l) Cell migration analysis (top panels) of PTEN−/− NSCs transduced with the lentiviral vector encoding PTEN, PTEN(G129E), PTEN(Y138L) or a luciferase control (Luc), and the expression of PTEN was determined by immunofluorescence (lower panels). Scale bars, 1 mm (migration assay) and 50 μm (IF). n=3. ***P<0.001 (t-test).
Figure 5
Figure 5. PTEN-PAX7 axis functions in GSCs and GBMs.
(a,b) Immunofluorescence analysis of the indicated antigens in GSCs (a) and their spontaneously differentiated derivatives (b). Scale bars, 1 mm (phase) and 25 μm (IF). (c,d) Cell migration assay indicating increased cellular mobility in PTEN-knocked down (c) or PAX7-overexpressed (d) GSC lines. n=3. ***P<0.001 (t-test). (e) GBM microarray data were obtained from TCGA website and spearman correlation was calculated by all the samples which were plotted by red and blue dots. The gene expression level was log2 lowess normalized. PAX7 expression negatively correlated with PTEN (Spearman correlation coefficient=−0.28, P value=1.0 × 10⁻¹¹). (f,g) FACS (f) and TdT-mediated dUTP nick end labelling (g) analyses of cell apoptosis in MMC (7.5 μM, 24 h) or vehicle-treated WT and PTEN−/− NSCs. n=6. *P<0.05 (t-test); ***P<0.001 (t-test); NS, not significant. (h) Representative bioluminescent images of PTEN−/− NSCs implanted animals in the presence or absence of MMC treatment are shown at day 70 after injection (left). Right panel indicates average bioluminescent signals. n=5 for dimethylsulphoxide (DMSO) treatment, and n=8 for MMC treatment. ***P<0.001 (t-test).

Similar articles

Cited by

References

    1. Furnari F. B. et al.. Malignant astrocytic glioma: genetics, biology, and paths to treatment. Genes Dev. 21, 2683–2710 (2007). - PubMed
    1. Bianco R. et al.. Loss of PTEN/MMAC1/TEP in EGF receptor-expressing tumor cells counteracts the antitumor action of EGFR tyrosine kinase inhibitors. Oncogene 22, 2812–2822 (2003). - PubMed
    1. Mellinghoff I. K. et al.. Molecular determinants of the response of glioblastomas to EGFR kinase inhibitors. N. Engl. J. Med. 353, 2012–2024 (2005). - PubMed
    1. Nagata Y. et al.. PTEN activation contributes to tumor inhibition by trastuzumab, and loss of PTEN predicts trastuzumab resistance in patients. Cancer cell 6, 117–127 (2004). - PubMed
    1. Dean M., Fojo T. & Bates S. Tumour stem cells and drug resistance. Nat. Rev. Cancer. 5, 275–284 (2005). - PubMed

Publication types

MeSH terms

Associated data