

Insulin and IGF-1 activate Kir4.1/5.1 channels in cortical collecting duct principal cells to control basolateral membrane voltage
- PMID: 26632606
- PMCID: PMC4839479
- DOI: 10.1152/ajprenal.00436.2015
Insulin and IGF-1 activate Kir4.1/5.1 channels in cortical collecting duct principal cells to control basolateral membrane voltage
Abstract
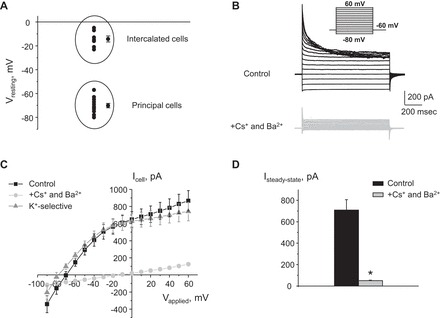
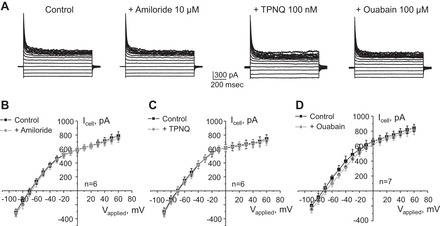
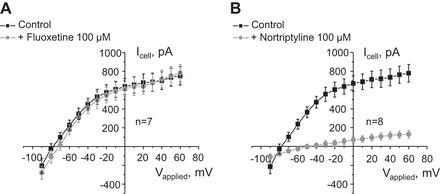
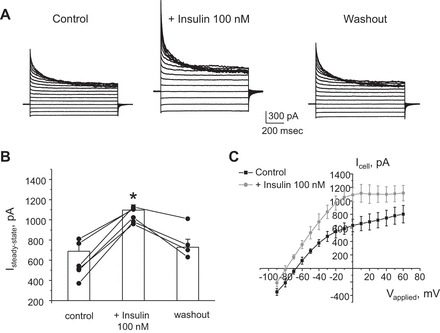
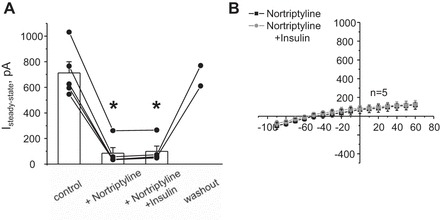
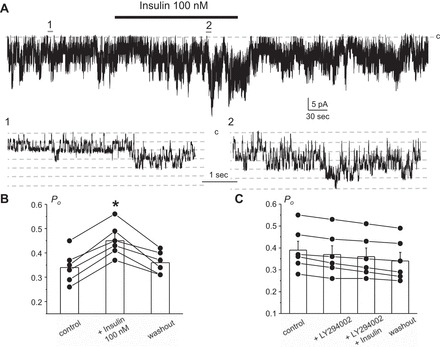
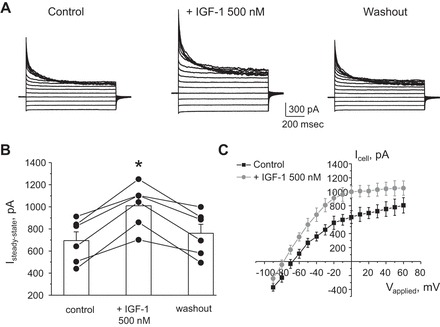
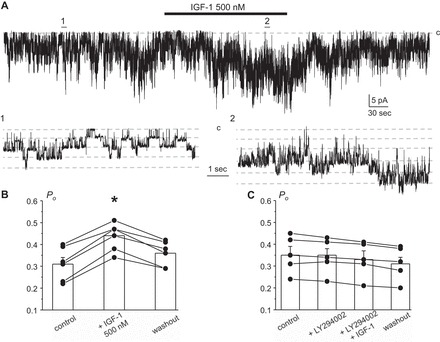
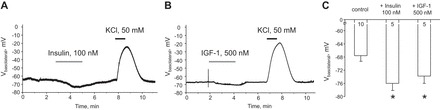
Potassium Kir4.1/5.1 channels are abundantly expressed at the basolateral membrane of principal cells in the cortical collecting duct (CCD), where they are thought to modulate transport rates by controlling transepithelial voltage. Insulin and insulin-like growth factor-1 (IGF-1) stimulate apically localized epithelial sodium channels (ENaC) to augment sodium reabsorption in the CCD. However, little is known about their actions on potassium channels localized at the basolateral membrane. In this study, we implemented patch-clamp analysis in freshly isolated murine CCD to assess the effect of these hormones on Kir4.1/5.1 at both single channel and cellular levels. We demonstrated that K(+)-selective conductance via Kir4.1/5.1 is the major contributor to the macroscopic current recorded from the basolateral side in principal cells. Acute treatment with 10 μM amiloride (ENaC blocker), 100 nM tertiapin-Q (TPNQ; ROMK inhibitor), and 100 μM ouabain (Na(+)-K(+)-ATPase blocker) failed to produce a measurable effect on the macroscopic current. In contrast, Kir4.1 inhibitor nortriptyline (100 μM), but not fluoxetine (100 μM), virtually abolished whole cell K(+)-selective conductance. Insulin (100 nM) markedly increased the open probability of Kir4.1/5.1 and nortriptyline-sensitive whole cell current, leading to significant hyperpolarization of the basolateral membrane. Inhibition of the phosphatidylinositol 3-kinase cascade with LY294002 (20 μM) abolished action of insulin on Kir4.1/5.1. IGF-1 had similar stimulatory actions on Kir4.1/5.1-mediated conductance only when applied at a higher (500 nM) concentration and was ineffective at 100 nM. We concluded that both insulin and, to a lesser extent, IGF-1 activate Kir4.1/5.1 channel activity and open probability to hyperpolarize the basolateral membrane, thereby facilitating Na(+) reabsorption in the CCD.
Keywords: PI3-kinase; distal nephron; nortriptyline; sodium reabsorption; transepithelial transport.
Copyright © 2016 the American Physiological Society.
Figures

Similar articles
-
Direct inhibition of basolateral Kir4.1/5.1 and Kir4.1 channels in the cortical collecting duct by dopamine.Am J Physiol Renal Physiol. 2013 Nov 1;305(9):F1277-87. doi: 10.1152/ajprenal.00363.2013. Epub 2013 Aug 28. Am J Physiol Renal Physiol. 2013. PMID: 23986512 Free PMC article.
-
Dietary K+ and Cl- independently regulate basolateral conductance in principal and intercalated cells of the collecting duct.Pflugers Arch. 2018 Feb;470(2):339-353. doi: 10.1007/s00424-017-2084-x. Epub 2017 Nov 13. Pflugers Arch. 2018. PMID: 29134279 Free PMC article.
-
Acute regulation of the epithelial Na+ channel by phosphatidylinositide 3-OH kinase signaling in native collecting duct principal cells.J Am Soc Nephrol. 2007 Jun;18(6):1652-61. doi: 10.1681/ASN.2007010020. Epub 2007 Apr 18. J Am Soc Nephrol. 2007. PMID: 17442787
-
[The function and regulation of basolateral Kir4.1 and Kir4.1/Kir5.1 in renal tubules].Sheng Li Xue Bao. 2018 Dec 25;70(6):600-606. Sheng Li Xue Bao. 2018. PMID: 30560268 Review. Chinese.
-
The expression, regulation, and function of Kir4.1 (Kcnj10) in the mammalian kidney.Am J Physiol Renal Physiol. 2016 Jul 1;311(1):F12-5. doi: 10.1152/ajprenal.00112.2016. Epub 2016 Apr 27. Am J Physiol Renal Physiol. 2016. PMID: 27122539 Free PMC article. Review.
Cited by
-
The normal increase in insulin after a meal may be required to prevent postprandial renal sodium and volume losses.Am J Physiol Regul Integr Comp Physiol. 2017 Jun 1;312(6):R965-R972. doi: 10.1152/ajpregu.00354.2016. Epub 2017 Mar 22. Am J Physiol Regul Integr Comp Physiol. 2017. PMID: 28330966 Free PMC article.
-
Inwardly rectifying potassium channel 5.1: Structure, function, and possible roles in diseases.Genes Dis. 2020 Mar 21;8(3):272-278. doi: 10.1016/j.gendis.2020.03.006. eCollection 2021 May. Genes Dis. 2020. PMID: 33997174 Free PMC article. Review.
-
Endogenous Bioelectric Signaling Networks: Exploiting Voltage Gradients for Control of Growth and Form.Annu Rev Biomed Eng. 2017 Jun 21;19:353-387. doi: 10.1146/annurev-bioeng-071114-040647. Annu Rev Biomed Eng. 2017. PMID: 28633567 Free PMC article. Review.
-
Physiological hyperinsulinemia caused by acute hyperglycemia minimizes renal sodium loss by direct action on kidneys.Am J Physiol Regul Integr Comp Physiol. 2018 Sep 1;315(3):R547-R552. doi: 10.1152/ajpregu.00016.2018. Epub 2018 May 23. Am J Physiol Regul Integr Comp Physiol. 2018. PMID: 29791205 Free PMC article.
-
Essential role of Kir5.1 channels in renal salt handling and blood pressure control.JCI Insight. 2017 Sep 21;2(18):e92331. doi: 10.1172/jci.insight.92331. eCollection 2017 Sep 21. JCI Insight. 2017. PMID: 28931751 Free PMC article.
References
-
- Bach LA, Hale LJ. Insulin-like growth factors and kidney disease. Am J Kidney Dis 65: 327–336, 2015. - PubMed
-
- Bergstrom RF, Beasley CM Jr, Levy NB, Blumenfield M, Lemberger L. The effects of renal and hepatic disease on the pharmacokinetics, renal tolerance, and risk-benefit profile of fluoxetine. Int Clin Psychopharmacol 8: 261–266, 1993. - PubMed
-
- Bockenhauer D, Feather S, Stanescu HC, Bandulik S, Zdebik AA, Reichold M, Tobin J, Lieberer E, Sterner C, Landoure G, Arora R, Sirimanna T, Thompson D, Cross JH, van't Hoff W, Al Masri O, Tullus K, Yeung S, Anikster Y, Klootwijk E, Hubank M, Dillon MJ, Heitzmann D, Arcos-Burgos M, Knepper MA, Dobbie A, Gahl WA, Warth R, Sheridan E, Kleta R. Epilepsy, ataxia, sensorineural deafness, tubulopathy, and KCNJ10 mutations. N Engl J Med 360: 1960–1970, 2009. - PMC - PubMed
-
- Bond CT, Pessia M, Xia XM, Lagrutta A, Kavanaugh MP, Adelman JP. Cloning and expression of a family of inward rectifier potassium channels. Receptors Channels 2: 183–191, 1994. - PubMed
Publication types
MeSH terms
Substances
Grants and funding
LinkOut - more resources
Full Text Sources
Other Literature Sources
Medical
Miscellaneous