

Comparison of Interaural Electrode Pairing Methods for Bilateral Cochlear Implants
- PMID: 26631108
- PMCID: PMC4771032
- DOI: 10.1177/2331216515617143
Comparison of Interaural Electrode Pairing Methods for Bilateral Cochlear Implants
Abstract
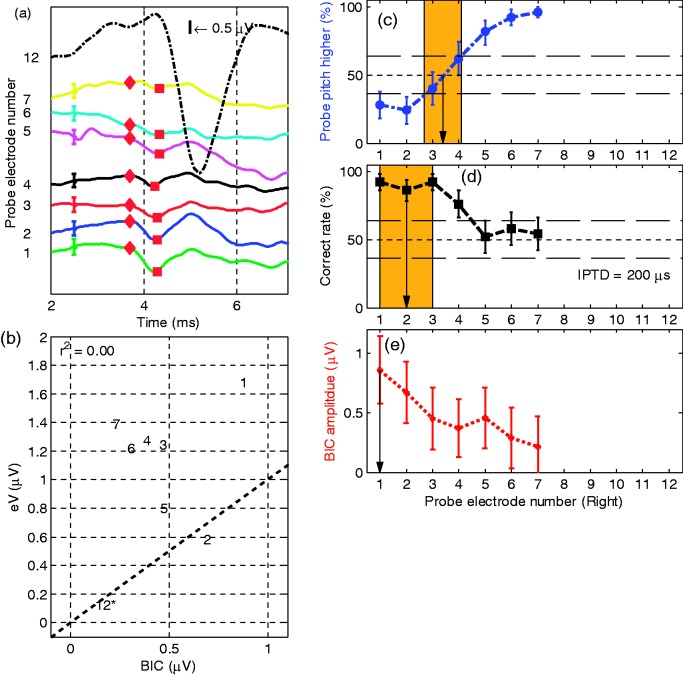
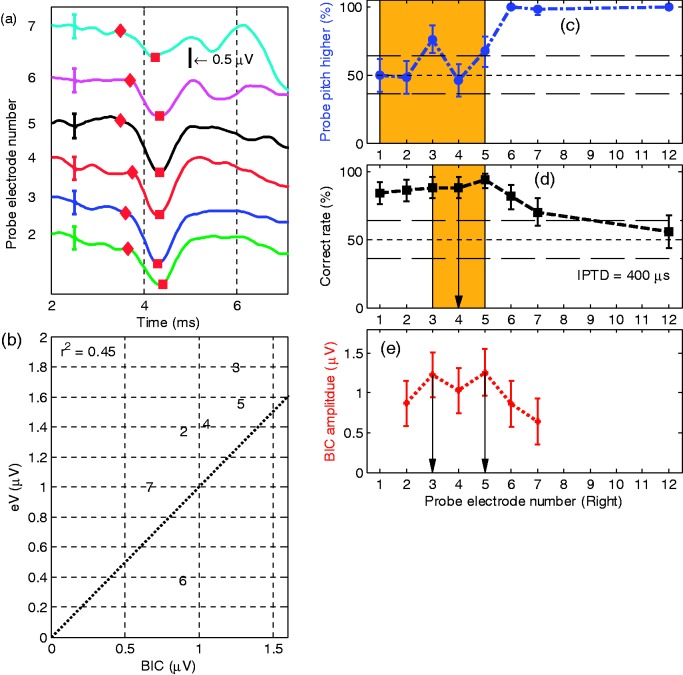
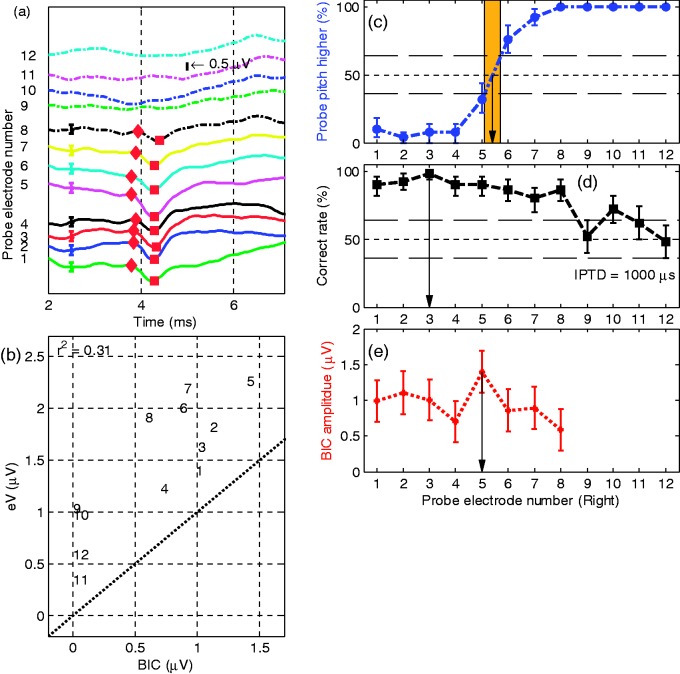
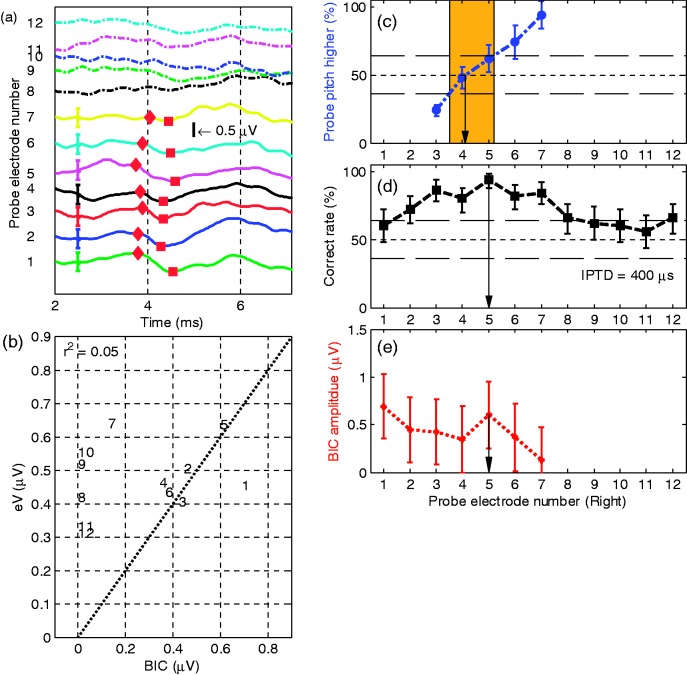
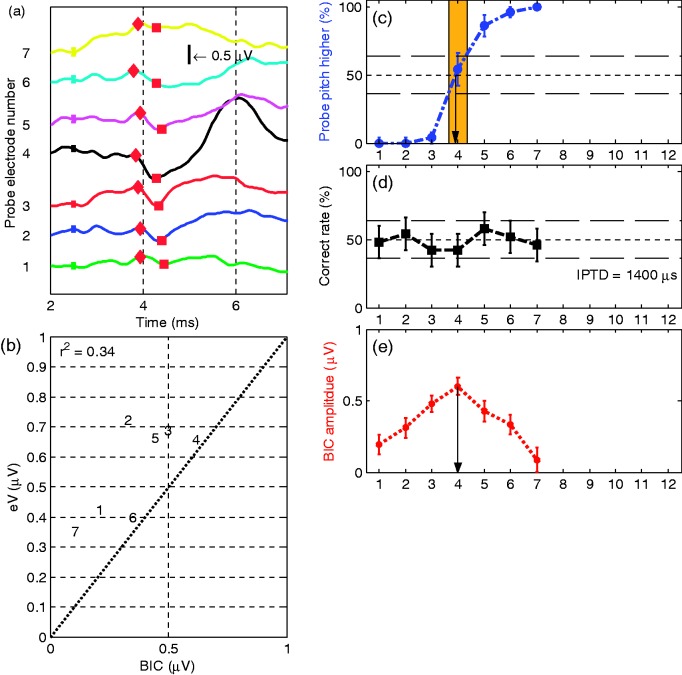
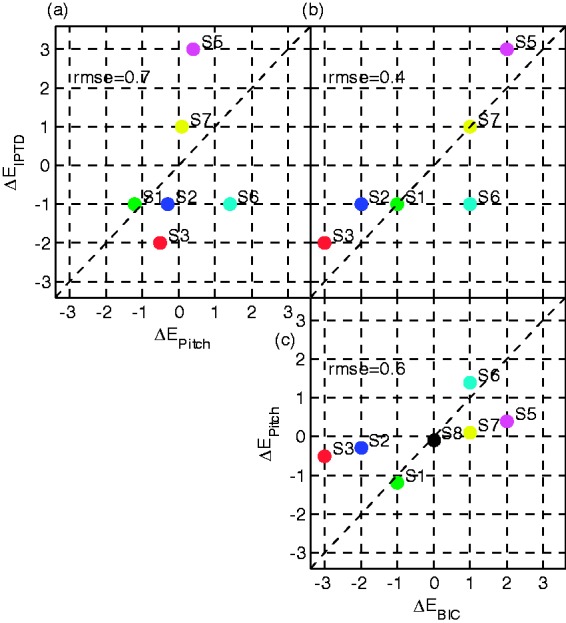
In patients with bilateral cochlear implants (CIs), pairing matched interaural electrodes and stimulating them with the same frequency band is expected to facilitate binaural functions such as binaural fusion, localization, and spatial release from masking. Because clinical procedures typically do not include patient-specific interaural electrode pairing, it remains the case that each electrode is allocated to a generic frequency range, based simply on the electrode number. Two psychoacoustic techniques for determining interaurally paired electrodes have been demonstrated in several studies: interaural pitch comparison and interaural time difference (ITD) sensitivity. However, these two methods are rarely, if ever, compared directly. A third, more objective method is to assess the amplitude of the binaural interaction component (BIC) derived from electrically evoked auditory brainstem responses for different electrode pairings; a method has been demonstrated to be a potential candidate for bilateral CI users. Here, we tested all three measures in the same eight CI users. We found good correspondence between the electrode pair producing the largest BIC and the electrode pair producing the maximum ITD sensitivity. The correspondence between the pairs producing the largest BIC and the pitch-matched electrode pairs was considerably weaker, supporting the previously proposed hypothesis that whilst place pitch might adapt over time to accommodate mismatched inputs, sensitivity to ITDs does not adapt to the same degree.
Keywords: bilateral cochlear implant; binaural interaction component; electrically evoked auditory brainstem response; interaural electrode pairing; interaural time difference; pitch comparison.
© The Author(s) 2015.
Figures

Similar articles
-
Suitability of the Binaural Interaction Component for Interaural Electrode Pairing of Bilateral Cochlear Implants.Adv Exp Med Biol. 2016;894:57-64. doi: 10.1007/978-3-319-25474-6_7. Adv Exp Med Biol. 2016. PMID: 27080646
-
Effects of interaural pitch matching and auditory image centering on binaural sensitivity in cochlear implant users.Ear Hear. 2015 May-Jun;36(3):e62-8. doi: 10.1097/AUD.0000000000000135. Ear Hear. 2015. PMID: 25565660 Free PMC article.
-
Using evoked potentials to match interaural electrode pairs with bilateral cochlear implants.J Assoc Res Otolaryngol. 2007 Mar;8(1):134-51. doi: 10.1007/s10162-006-0069-0. Epub 2007 Jan 17. J Assoc Res Otolaryngol. 2007. PMID: 17225976 Free PMC article.
-
Perception and coding of interaural time differences with bilateral cochlear implants.Hear Res. 2015 Apr;322:138-50. doi: 10.1016/j.heares.2014.10.004. Epub 2014 Oct 19. Hear Res. 2015. PMID: 25456088 Review.
-
Auditory Model-Based Sound Direction Estimation With Bilateral Cochlear Implants.Trends Hear. 2015 Dec 1;19:2331216515616378. doi: 10.1177/2331216515616378. Trends Hear. 2015. PMID: 26631106 Free PMC article. Review.
Cited by
-
Neural Representation of Interaural Time Differences in Humans-an Objective Measure that Matches Behavioural Performance.J Assoc Res Otolaryngol. 2016 Dec;17(6):591-607. doi: 10.1007/s10162-016-0584-6. Epub 2016 Sep 14. J Assoc Res Otolaryngol. 2016. PMID: 27628539 Free PMC article.
-
Clinical Feasibility and Familiarization Effects of Device Delay Mismatch Compensation in Bimodal CI/HA Users.Trends Hear. 2023 Jan-Dec;27:23312165231171987. doi: 10.1177/23312165231171987. Trends Hear. 2023. PMID: 37194477 Free PMC article.
-
A Comparison of Place-Pitch-Based Interaural Electrode Matching Methods for Bilateral Cochlear-Implant Users.Trends Hear. 2021 Jan-Dec;25:2331216521997324. doi: 10.1177/2331216521997324. Trends Hear. 2021. PMID: 34057382 Free PMC article.
-
Aging alters across-hemisphere cortical dynamics during binaural temporal processing.Front Neurosci. 2023 Jan 10;16:1060172. doi: 10.3389/fnins.2022.1060172. eCollection 2022. Front Neurosci. 2023. PMID: 36703999 Free PMC article.
-
The Effect of Simulated Interaural Frequency Mismatch on Speech Understanding and Spatial Release From Masking.Ear Hear. 2018 Sep/Oct;39(5):895-905. doi: 10.1097/AUD.0000000000000541. Ear Hear. 2018. PMID: 29337763 Free PMC article.
References
-
- Abbas P. J., Brown C. J. (1988) Electrically evoked brainstem potentials in cochlear implant patients with multi-electrode stimulation. Hearing Research 36(2–3): 153–162. - PubMed
-
- Bahmer A., Peter O., Baumann U. (2008) Recording of electrically evoked auditory brainstem responses (E-ABR) with an integrated stimulus generator in Matlab. Journal of Neuroscience Methods 173(2): 306–314. - PubMed
-
- Brown C. J., Abbas P. J., Fryauf-Bertschy H., Kelsay D., Gantz B. J. (1994) Intraoperative and postoperative electrically evoked auditory brain stem responses in nucleus cochlear implant users: Implications for the fitting process. Ear and Hearing 15(2): 168–176. - PubMed
-
- Brown C. J., Hughes M. L., Luk B., Abbas P. J., Wolaver A., Gervais J. (2000) The relationship between EAP and EABR thresholds and levels used to program the nucleus 24 speech processor: Data from adults. Ear and Hearing 21(2): 151–163. - PubMed
-
- Carlyon R. P., Macherey O., Frijns J. H. M., Axon P. R., Kalkman R. K., Boyle P., Dauman R. (2010) Pitch comparisons between electrical stimulation of a cochlear implant and acoustic stimuli presented to a normal-hearing contralateral ear. Journal of the Association for Research in Otolaryngology 11(4): 625–640. - PMC - PubMed
Publication types
MeSH terms
LinkOut - more resources
Full Text Sources
Other Literature Sources
Medical
