. 2016 Jan 22;291(4):1974-1990.
doi: 10.1074/jbc.M115.674861. Epub 2015 Dec 1.

Oxidative Stress Attenuates Lipid Synthesis and Increases Mitochondrial Fatty Acid Oxidation in Hepatoma Cells Infected with Hepatitis C Virus

Affiliations

Oxidative Stress Attenuates Lipid Synthesis and Increases Mitochondrial Fatty Acid Oxidation in Hepatoma Cells Infected with Hepatitis C Virus

Donna N Douglas et al. J Biol Chem. .

Abstract

Cytopathic effects are currently believed to contribute to hepatitis C virus (HCV)-induced liver injury and are readily observed in Huh7.5 cells infected with the JFH-1 HCV strain, manifesting as apoptosis highly correlated with growth arrest. Reactive oxygen species, which are induced by HCV infection, have recently emerged as activators of AMP-activated protein kinase. The net effect is ATP conservation via on/off switching of metabolic pathways that produce/consume ATP. Depending on the scenario, this can have either pro-survival or pro-apoptotic effects. We demonstrate reactive oxygen species-mediated activation of AMP-activated kinase in Huh7.5 cells during HCV (JFH-1)-induced growth arrest. Metabolic labeling experiments provided direct evidence that lipid synthesis is attenuated, and β-oxidation is enhanced in these cells. A striking increase in nuclear peroxisome proliferator-activated receptor α, which plays a dominant role in the expression of β-oxidation genes after ligand-induced activation, was also observed, and we provide evidence that peroxisome proliferator-activated receptor α is constitutively activated in these cells. The combination of attenuated lipid synthesis and enhanced β-oxidation is not conducive to lipid accumulation, yet cellular lipids still accumulated during this stage of infection. Notably, the serum in the culture media was the only available source for polyunsaturated fatty acids, which were elevated (2-fold) in the infected cells, implicating altered lipid import/export pathways in these cells. This study also provided the first in vivo evidence for enhanced β-oxidation during HCV infection because HCV-infected SCID/Alb-uPA mice accumulated higher plasma ketones while fasting than did control mice. Overall, this study highlights the reprogramming of hepatocellular lipid metabolism and bioenergetics during HCV infection, which are predicted to impact both the HCV life cycle and pathogenesis.

Keywords: AMP-activated kinase (AMPK); hepatitis C virus (HCV); lipogenesis; oxidative stress; β-oxidation.


Figures

FIGURE 1.
FIGURE 1.
HCV-mediated cell cycle arrest. A, expression of HCV core in naive and infected Huh7.5 (at 10 days post-infection with JFH-1, m.o.i. = 0.01). HCV-positive cells were detected using an anti-core antibody (red), whereas all cell nuclei are shown using DAPI (blue). Micrographs are representative of all naive and infected cell cultures enrolled in the studies herein. B, analysis of proliferating cells in infected Huh7.5 cell cultures (at 10 days post-infection with JFH-1, m.o.i. = 0.01). Naive cells were used as controls. Following a 3-h pulse with EdU to label cells in S-phase, cells were enumerated by flow cytometry. Results are expressed as means ± S.E. for n = 4 independent experiments. C, analysis of cell viability of infected Huh7.5 cells (at 10 days post-infection with JFH-1, m.o.i. = 0.01). Naive cells were used as controls. Cell viability was determined by MTT assay. Results are expressed as means ± S.E. for n = 4 independent experiments. D, analysis of ROS levels in infected Huh7.5 (at 10 days post-infection with JFH-1, m.o.i. = 0.01). Naive cells were used as controls. Intracellular ROS/RNS and H2O2 levels were examined using H2DCF-DA and OxiSelect detection reagents, respectively. Results are expressed as means ± S.E. for n = 4 independent experiments.
FIGURE 2.
FIGURE 2.
ROS-dependent activation of AMPK in infected cells. A, cellular levels of AMPK and AMPK phosphorylated on Thr-172 (P-AMPK) in infected Huh7.5 cells (at 10 days post-infection with JFH-1, m.o.i. = 0.01) were determined by immunoblot analysis. Naive cells were used as controls. Blots were stripped and re-probed for HCV NS5A (infection control) and actin (loading control). Immunoblots are representative of four independent experiments. B, analysis of ROS levels in infected Huh7.5 cells (at 10 days post-infection with JFH-1, m.o.i. = 0.01). Intracellular ROS levels in infected Huh7.5 cells (at 10 days post-infection with JFH-1, m.o.i. = 0.01) were examined after pre-treatment with or without α-tocopherol (±100 μm) or NAC (±5 mm) for 24 h. H2DCF-DA was used as the detection reagent. Results are expressed as means ± S.E. for n = 4 independent experiments. C, cellular levels of AMPK and AMPK phosphorylated on Thr-172 (P-AMPK) in infected Huh7.5 cells (at 10 days post-infection with JFH-1, m.o.i. = 0.01) were determined by immunoblot analysis after pretreatment for 1 h with or without α-tocopherol (±100 μm). Blots were stripped and re-probed for HCV core (infection control) and actin (loading control). Immunoblots are representative of four independent experiments. AMPK and p-AMPK bands were quantified using the Odyssey CLx Infrared Imaging System and normalized to actin (right). Results are expressed as means ± S.E. for n = 4 independent experiments.
FIGURE 3.
FIGURE 3.
Increased inhibition of ACC correlates with attenuated malonyl-CoA levels in infected cells. A, cellular levels of ACC and ACC phosphorylated on Ser-79 (P-ACC) in infected Huh7.5 cells (at 10 days post-infection with JFH-1, m.o.i. = 0.01) were determined by immunoblot analysis. Naive cells were used as controls. Blots were stripped and re-probed for HCV NS5A (infection control) and actin (loading control). Immunoblots are representative of four independent experiments. ACC and p-ACC bands were quantified using the Odyssey CLx infrared imaging system and normalized to actin (right). Results are expressed as means ± S.E. for n = 4 independent experiments. B, analysis of malonyl-CoA levels in ROS levels in infected Huh7.5 cells infected with JFH-1 (10 days post-infection, m.o.i. = 0.01). Naive cells were used as controls. Results are expressed as means ± S.E. for n = 4 independent experiments.
FIGURE 4.
FIGURE 4.
Attenuated DNL in infected cells. DNL activity was measured in infected Huh7.5 cells (at 10 days post-infection with JFH-1, m.o.i. = 0.01) by the incorporation of [3H]acetate into cellular lipids. Naive cells were used as controls. TAG, triacylglycerol; CE, cholesteryl ester; PL, phospholipid; FC, free cholesterol; FFA, free fatty acid. Results are expressed as means ± S.E. for n = 4 independent experiments.
FIGURE 5.
FIGURE 5.
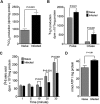
Enhanced β-oxidation in infected cells. A, JFH-1-infected Huh7. 5 cells (at 10 days post-infection, m.o.i. = 0.01) were incubated with [9,10-3H]oleic acid for 4 h (pulse), followed by incubation in DMEM (chase). Naive cells were used as controls. Media equivalent to 500 μg of cell protein were analyzed for radioactivity in the form of 3H2O as described under “Experimental Procedures.” Results are expressed as means ± S.E. for n = 4 independent experiments. B, JFH-1-infected Huh7.5 cells (at 10 days post-infection, m.o.i. = 0.01) were incubated with [1-14C]oleic acid for 4 h, and the 14CO2 production from the complete β-oxidation of [1-14C]oleic acid was analyzed as described under “Experimental Procedures.” Naive cells were used as a control. Results are expressed as means ± S.E. for n = 4 independent experiments. C, JFH-1-infected cells (at 10 days post-infection, m.o.i. = 0.01) were incubated with [9,10-3H]oleic acid for the indicated times and then lysed, and the amount of radioactivity in lysates was determined by scintillation counting. Naive cells were used as a control. Results are expressed as means ± S.E. for n = 4 independent experiments. D, cellular ATP levels were analyzed in JFH-1-infected cells (at 10 days post-infection, m.o.i. =0.01). Naive cells were used as a control. Results are expressed as means ± S.E. for n = 4 independent experiments.
FIGURE 6.
FIGURE 6.
Increased nuclear PPARα correlates with increased cellular CPT1 and enhanced expression of β-oxidation genes in infected cells. A, nuclear PPARα levels in infected Huh7.5 cells (at 10 days post-infection with JFH-1, m.o.i. = 0.01) were analyzed by immunoblot analysis. Naive cells were used as a control. Blots were stripped and re-probed for histone (H2B, loading control). Immunoblot is representative of n = 4 independent experiments. B, cellular CPT1 levels in infected Huh7.5 cells (at 10 days post-infection with JFH-1, m.o.i. = 0.01) were analyzed by quantitative immunoblot analysis (right). Immunoblot is representative of n = 4 experiments, and results are expressed as means ± S.E. for n = 4 independent experiments. Naive cells were used as a control. Blots were stripped and re-probed for actin (loading control) and HCV core (infection control). C, infected Huh7.5 cells (at 10 days post-infection with JFH-1, m.o.i. = 0.01) were transfected with the PPAR reporter supplied by the CignalTM PPAR reporter (luc) kit. After 24 h of transfection, the media were changed to DMEM containing 10% FBS with (300 μm) or without (0 mm) GW7647 in DMSO. The final DMSO concentration did not exceed 0.1% (v/v). Dual luciferase assay was performed 24 h post-treatment, and promoter activity values are expressed as arbitrary units using a Renilla reporter for internal normalization. Naive cells were used as a control. Results are expressed as means ± S.E. for n = 4 independent experiments. D, expression of genes encoding CPT1, acetyl-CoA carboxylase 2 (ACC2), very long-, long-, and medium-chain acyl-CoA dehydrogenase (VLCAD, LCAD, and MCAD, respectively), acyl-CoA oxidase, and PPARα were quantified by quantitative RT-PCR in infected Huh7.5 cells (at 10 days post-infection with JFH-1, m.o.i. = 0.01) and normalized to actin. Naive cells were used as a control. Results are expressed as means ± S.E. for n = 4 independent experiments.
FIGURE 7.
FIGURE 7.
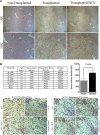
SCID/Alb-uPA mice infected with HCV exhibit enhanced β-oxidation. A, engrafted human hepatocytes (brown nuclei) in paraffin-embedded liver sections were distinguished from mouse hepatocytes and other murine constituents (blue nuclei) by hybridization with fluoresceinated Alu probe. A representative liver from SCID/uPA mice transplanted with cryopreserved human hepatocytes and sacrificed at 111–115 days after transplantation is shown. For comparison, a representative liver from a non-transplanted littermate and donor-matched transplanted littermate that had been inoculated with serum from an HCV genotype 1A-infected patient 2 weeks prior to sacrifice are also shown. The HCV serum titer at time of sacrifice was 5.25 × 10⁶ HCV RNA/ml. ×5 and ×10 magnifications display large areas of the liver sections that exhibit cytoplasmic vacuolations (within red border) localized to areas dominated by engrafted human hepatocytes. By contrast, these cytoplasmic vacuolations are absent from non-transplanted mice and regions dominated by murine constituents. These vacuolations have been characterized previously (91) and are due to hepatic steatosis (91). B, SCID/Alb-uPA mice (n = 8) were transplanted with cryopreserved human hepatocytes at 10–14 days after birth. Half of the mice (n = 4) were inoculated with serum obtained from an HCV genotype 1a patient (10E5 IU RNA in 50 μl). The remaining mice (n = 4) were not inoculated (naive). At 2 weeks post-inoculation, naive and infected mice were fasted for 16 h prior to blood collection for serum hAAT, serum HCV RNA, and plasma ketone analysis. The outcomes are supplied in the table (left), and the plasma ketone analysis is expressed as means ± S.E. for n = 4 mice (right). HCV antigens (core and NS5A) and human hepatocytes (brown) were detected in paraffin-embedded liver sections by hybridization with fluoresceinated Alu probe and indirect immunohistochemical staining. Serial sections were processed for simultaneous detection of HCV antigens and Alu-positive hepatocytes (Alu + HCV), HCV antigens (HCV), and Alu-positive hepatocytes (Alu). As a control for background staining, isotype control antibody was used for the primary incubation. Representative micrographs are shown for transplanted naive mice (mouse B.A213) and transplanted mice infected with HCV (mouse B.A217).
FIGURE 8.
FIGURE 8.
Lipids accumulate in infected cells with changes in fatty acid composition and derived fatty acid indices. Lipids were extracted from infected Huh7.5 cells (at 10 days post-infection with JFH-1, m.o.i. = 0.01). Naive cells were used as a control. A, cellular levels of FC, CE, PL, and TAG were determined via gas chromatography. Results are expressed as means ± S.E. for n = 4 independent experiments. B, corresponding fatty acids were converted to fatty acid methyl esters and analyzed by gas-liquid chromatography. The relative contributions of saturated and monounsaturated fatty acids and PUFA to the total fatty acids are shown. Results are expressed as means ± S.E. for n = 4 independent experiments. C, elongase activity index (18:0/16:0), SCD1 activity index (18:1n-9/18:0), and Δ6 desaturase activity index (20:4n-6/18:2n-6). Results are expressed as means ± S.E. for n = 4 independent experiments.

Similar articles

Cited by

References

    1. Alter M. J., Margolis H. S., Krawczynski K., Judson F. N., Mares A., Alexander W. J., Hu P. Y., Miller J. K., Gerber M. A., and Sampliner R. E. (1992) The natural history of community-acquired hepatitis C in the United States. The Sentinel Counties Chronic non-A, non-B Hepatitis Study Team. N. Engl. J. Med. 327, 1899–1905 - PubMed
    1. Nelson D. R. (2001) The immunopathogenesis of hepatitis C virus infection. Clin. Liver Dis. 5, 931–953 - PubMed
    1. Mengshol J. A., Golden-Mason L., and Rosen H. R. (2007) Mechanisms of disease: HCV-induced liver injury. Nat. Clin. Pract. Gastroenterol. Hepatol. 4, 622–634 - PubMed
    1. Thomas D. L., and Seeff L. B. (2005) Natural history of hepatitis C. Clin. Liver Dis. 9, 383–398 - PubMed
    1. Ivanov A. V., Bartosch B., Smirnova O. A., Isaguliants M. G., and Kochetkov S. N. (2013) HCV and oxidative stress in the liver. Viruses 5, 439–469 - PMC - PubMed

Publication types

MeSH terms