Cell-to-cell variability in the propensity to transcribe explains correlated fluctuations in gene expression
- PMID: 26623441
- PMCID: PMC4662655
- DOI: 10.1016/j.cels.2015.10.011
Cell-to-cell variability in the propensity to transcribe explains correlated fluctuations in gene expression
Abstract
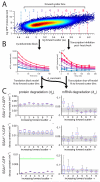
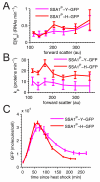
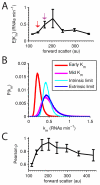
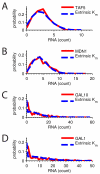
Random fluctuations in gene expression lead to wide cell-to-cell differences in RNA and protein counts. Most efforts to understand stochastic gene expression focus on local (intrinisic) fluctuations, which have an exact theoretical representation. However, no framework exists to model global (extrinsic) mechanisms of stochasticity. We address this problem by dissecting the sources of stochasticity that influence the expression of a yeast heat shock gene, SSA1. Our observations suggest that extrinsic stochasticity does not influence every step of gene expression, but rather arises specifically from cell-to-cell differences in the propensity to transcribe RNA. This led us to propose a framework for stochastic gene expression where transcription rates vary globally in combination with local, gene-specific fluctuations in all steps of gene expression. The proposed model better explains total expression stochasticity than the prevailing ON-OFF model and offers transcription as the specific mechanism underlying correlated fluctuations in gene expression.
Figures


Similar articles
-
Applications of Little's Law to stochastic models of gene expression.Phys Rev E Stat Nonlin Soft Matter Phys. 2010 Aug;82(2 Pt 1):021901. doi: 10.1103/PhysRevE.82.021901. Epub 2010 Aug 3. Phys Rev E Stat Nonlin Soft Matter Phys. 2010. PMID: 20866831
-
Stochasticity in single gene expression with both intrinsic noise and fluctuation in kinetic parameters.J Theor Biol. 2009 Feb 21;256(4):485-92. doi: 10.1016/j.jtbi.2008.10.028. Epub 2008 Nov 12. J Theor Biol. 2009. PMID: 19056400
-
Transient changes in intercellular protein variability identify sources of noise in gene expression.Biophys J. 2014 Nov 4;107(9):2214-20. doi: 10.1016/j.bpj.2014.09.017. Biophys J. 2014. PMID: 25418106 Free PMC article.
-
Phenotypic Variability in Synthetic Biology Applications: Dealing with Noise in Microbial Gene Expression.Front Microbiol. 2016 Apr 8;7:479. doi: 10.3389/fmicb.2016.00479. eCollection 2016. Front Microbiol. 2016. PMID: 27092132 Free PMC article. Review.
-
Stochastic and delayed stochastic models of gene expression and regulation.Math Biosci. 2010 Jan;223(1):1-11. doi: 10.1016/j.mbs.2009.10.007. Epub 2009 Oct 31. Math Biosci. 2010. PMID: 19883665 Review.
Cited by
-
Mammalian gene expression variability is explained by underlying cell state.Mol Syst Biol. 2020 Feb;16(2):e9146. doi: 10.15252/msb.20199146. Mol Syst Biol. 2020. PMID: 32043799 Free PMC article.
-
Dosage-Dependent Expression Variation Suppressed on the Drosophila Male X Chromosome.G3 (Bethesda). 2018 Feb 2;8(2):587-598. doi: 10.1534/g3.117.300400. G3 (Bethesda). 2018. PMID: 29242386 Free PMC article.
-
Mother-Fetus Immune Cross-Talk Coordinates "Extrinsic"/"Intrinsic" Embryo Gene Expression Noise and Growth Stability.Int J Mol Sci. 2022 Oct 18;23(20):12467. doi: 10.3390/ijms232012467. Int J Mol Sci. 2022. PMID: 36293324 Free PMC article.
-
Estrogen-dependent control and cell-to-cell variability of transcriptional bursting.Mol Syst Biol. 2018 Feb 23;14(2):e7678. doi: 10.15252/msb.20177678. Mol Syst Biol. 2018. PMID: 29476006 Free PMC article.
-
Two-level modeling approach to identify the regulatory dynamics capturing drug response heterogeneity in single-cells.Sci Rep. 2021 Oct 21;11(1):20809. doi: 10.1038/s41598-021-99943-0. Sci Rep. 2021. PMID: 34675364 Free PMC article.
References
-
- Bar-Even Arren, Paulsson Johan, Maheshri Narendra, Carmi Miri, O’Shea Erin, Pilpel Yitzhak, Barkai Naama. Noise in protein expression scales with natural protein abundance. Nature genetics. 2006;38(6):636–43. - PubMed
-
- Becskei Attila, Kaufmann Benjamin B, van Oudenaarden Alexander. Contributions of low molecule number and chromosomal positioning to stochastic gene expression. Nature genetics. 2005;37(9):937–44. - PubMed
-
- Blake William J, Balázsi Gábor, Kohanski Michael, Isaacs Farren J, Murphy Kevin F, Kuang Yina, Cantor Charles R, Walt David R, Collins James J. Phenotypic consequences of promoter-mediated transcriptional noise. Molecular cell. 2006;24(6):853–65. - PubMed
-
- Blake William J, KAErn Mads, Cantor Charles R, Collins JJ. Noise in eukaryotic gene expression. Nature. 2003;422(6932):633–7. - PubMed
Grants and funding
LinkOut - more resources
Full Text Sources
Other Literature Sources
Molecular Biology Databases
Miscellaneous

