. 2015 Nov 25;35(47):15599-611.
doi: 10.1523/JNEUROSCI.2544-15.2015.

Ischemic Preconditioning in White Matter: Magnitude and Mechanism

Affiliations

Ischemic Preconditioning in White Matter: Magnitude and Mechanism

Margaret A Hamner et al. J Neurosci. .

Abstract

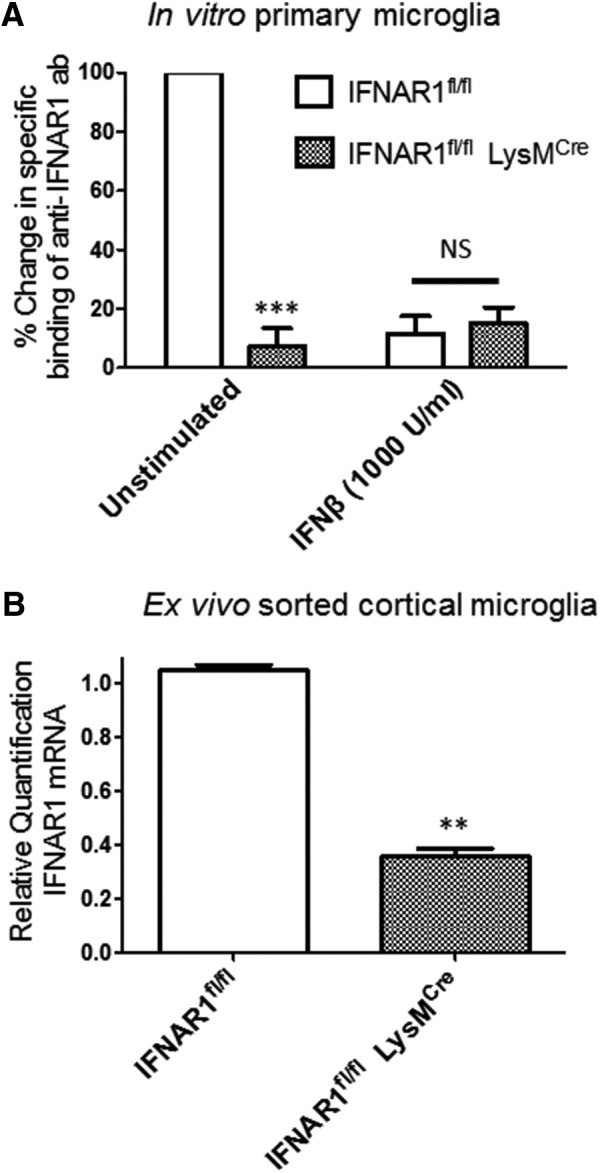
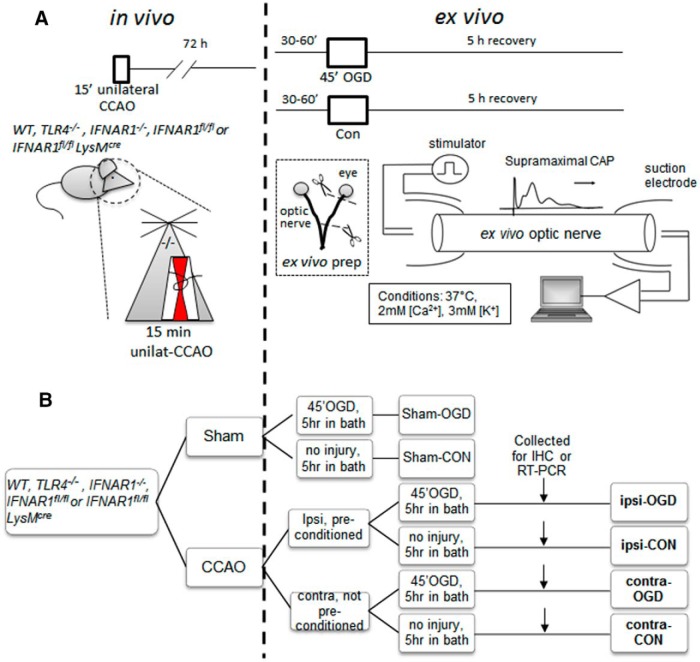
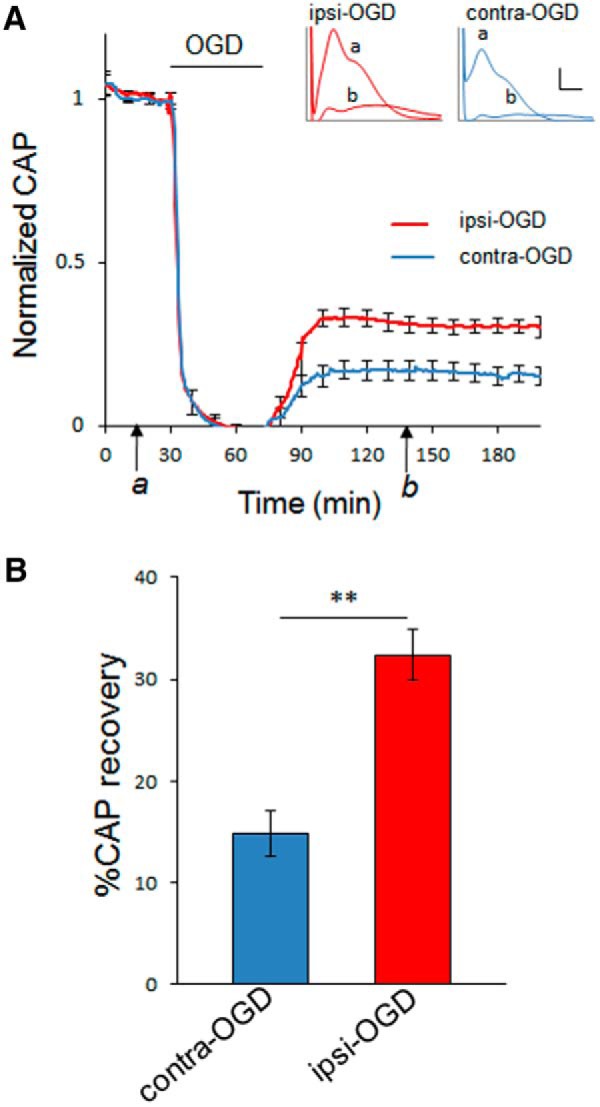
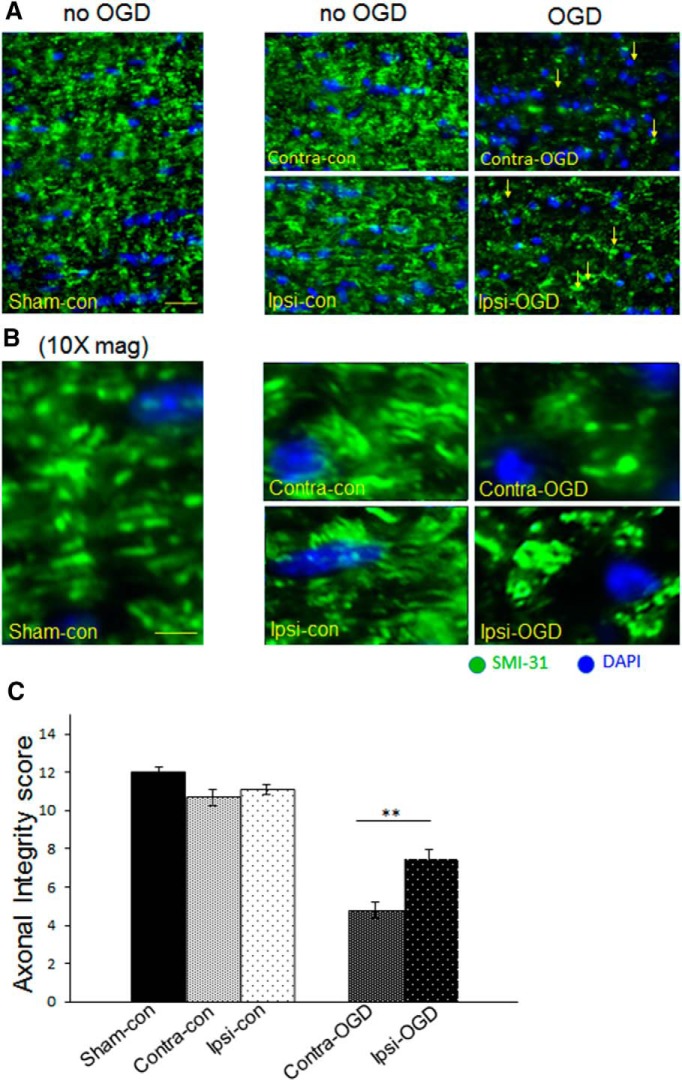
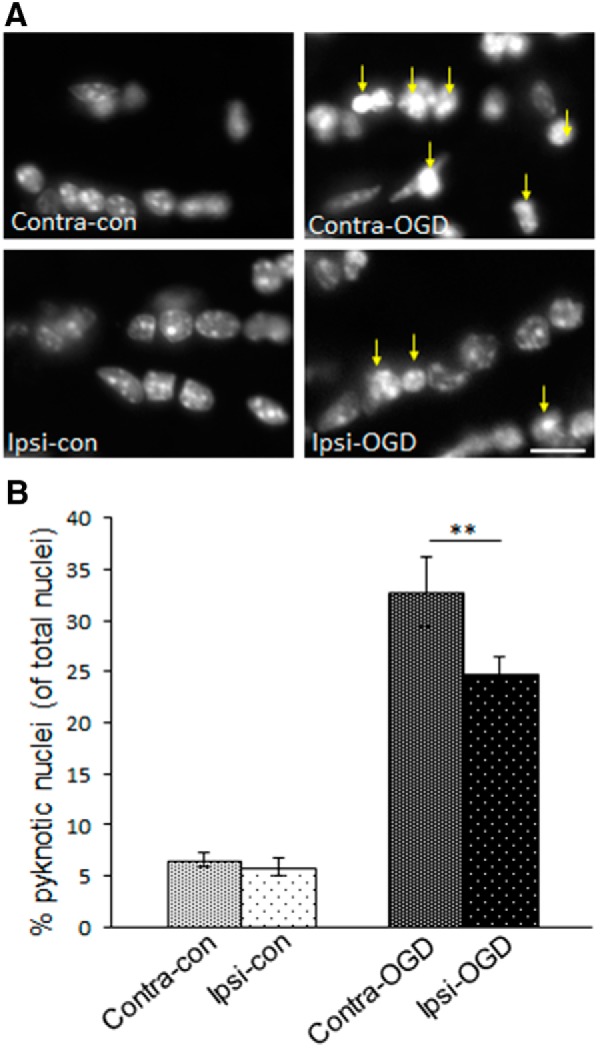
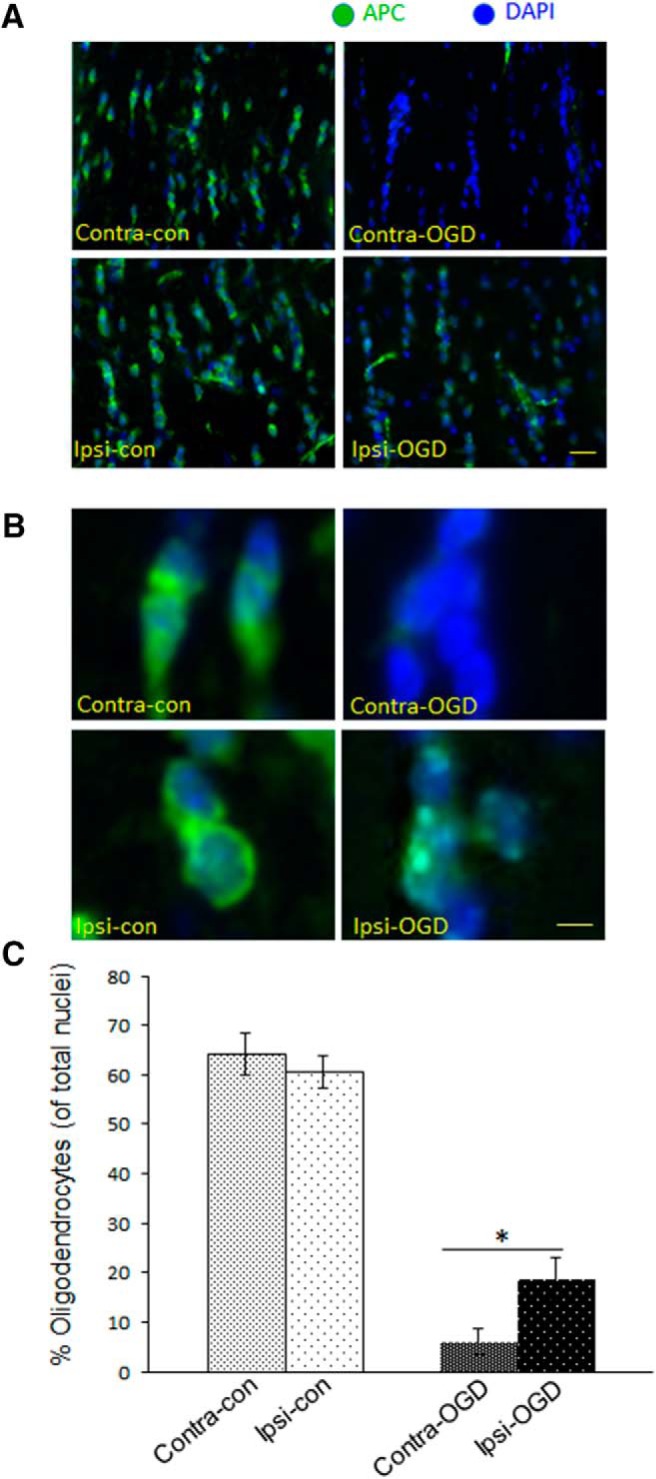
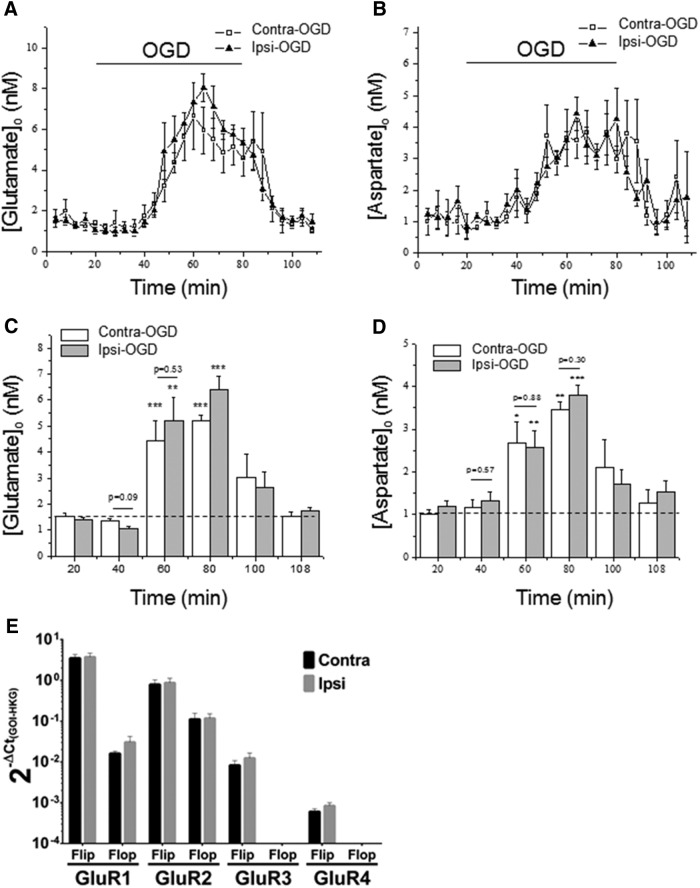
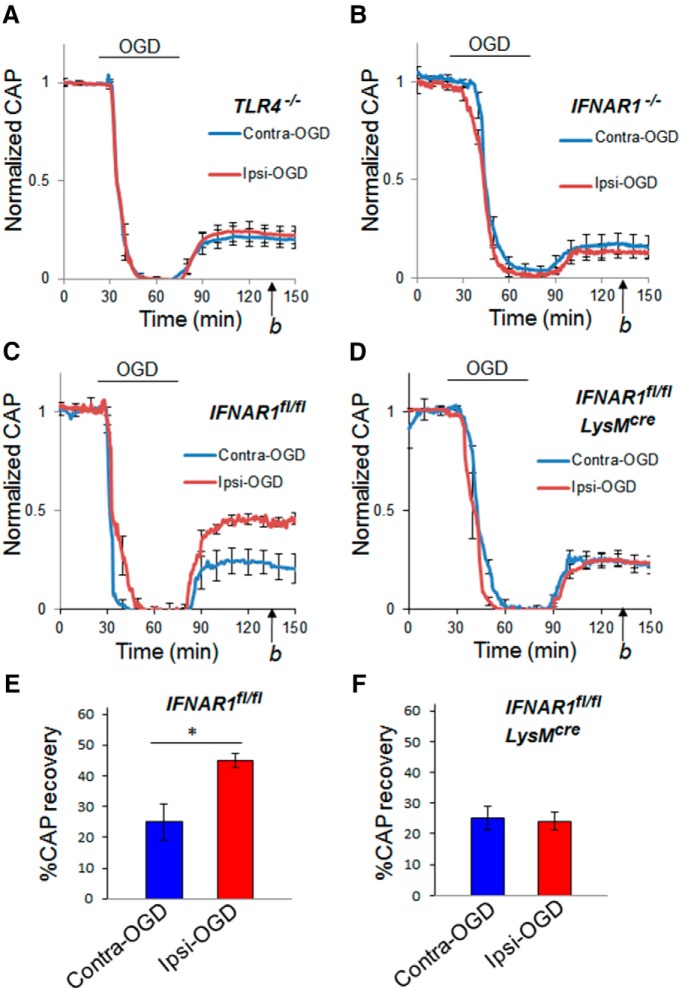
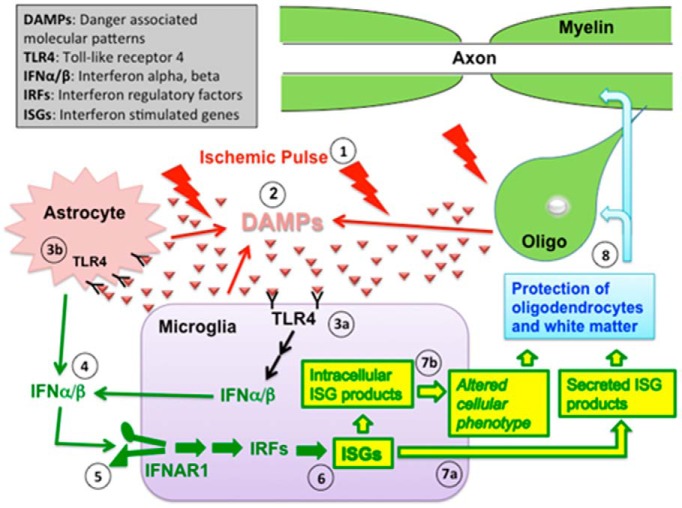
Ischemic preconditioning (IPC) is a robust neuroprotective phenomenon whereby brief ischemic exposure confers tolerance to a subsequent ischemic challenge. IPC has not been studied selectively in CNS white matter (WM), although stroke frequently involves WM. We determined whether IPC is present in WM and, if so, its mechanism. We delivered a brief in vivo preconditioning ischemic insult (unilateral common carotid artery ligation) to 12- to 14-week-old mice and determined WM ischemic vulnerability [oxygen-glucose deprivation (OGD)] 72 h later, using acutely isolated optic nerves (CNS WM tracts) from the preconditioned (ipsilateral) and control (contralateral) hemispheres. Functional and structural recovery was assessed by quantitative measurement of compound action potentials (CAPs) and immunofluorescent microscopy. Preconditioned mouse optic nerves (MONs) showed better functional recovery after OGD than the non-preconditioned MONs (31 ± 3 vs 17 ± 3% normalized CAP area, p < 0.01). Preconditioned MONs also showed improved axon integrity and reduced oligodendrocyte injury compared with non-preconditioned MONs. Toll-like receptor-4 (TLR4) and type 1 interferon receptor (IFNAR1), key receptors in innate immune response, are implicated in gray matter preconditioning. Strikingly, IPC-mediated WM protection was abolished in both TLR4(-/-) and IFNAR1(-/-) mice. In addition, IPC-mediated protection in WM was also abolished in IFNAR1(fl/fl) LysM(cre), but not in IFNAR1(fl/fl) control, mice. These findings demonstrated for the first time that IPC was robust in WM, the phenomenon being intrinsic to WM itself. Furthermore, WM IPC was dependent on innate immune cell signaling pathways. Finally, these data demonstrated that microglial-specific expression of IFNAR1 plays an indispensable role in WM IPC.

Significance statement: Ischemic preconditioning (IPC) has been studied predominantly in gray matter, but stroke in humans frequently involves white matter (WM) as well. Here we describe a novel, combined in vivo/ex vivo mouse model to determine whether IPC occurs in WM. It does. Using genetically altered mice, we identified two innate immune cell receptors, Toll-like receptor 4 and type 1 interferon receptor (IFNAR1), that are required for IPC-mediated protection in WM. Furthermore, using microglia-targeted IFNAR1 knockdown, we demonstrate that interferon signaling specifically in microglia is essential for this protection. The discovery of IPC as an intrinsic capability of WM is novel and important. This is also the first in vivo demonstration that cell-type-specific expression of an individual gene plays an indispensable role in IPC-mediated protection.

Keywords: interferon; ischemic preconditioning; microglia; toll-like receptor-4; white matter.


Conflict of interest statement

The authors declare no competing financial interests.

Figures

Figure 1.
Figure 1.
IFNAR1 knockdown in both in vitro cultured and ex vivo sorted microglia from IFNAR1fl/fl and IFNAR1fl/fl LysMcre mice. A, Primary microglia were derived from either IFNAR1fl/fl or IFNAR1fl/fl LysMcre mice as described in Materials and Methods, serum starved, and then either unstimulated or treated with IFNβ (1000 U/ml) for 24 h. Normalized specific binding (mean ± SEM) of anti-IFNAR1 antibody was quantified by flow cytometry as described in Materials and Methods. ***p < 0.001 compared with unstimulated IFNAR1fl/fl microglia. n = 3 experiments. B, Results of qRT-PCR quantifying steady-state levels of IFNAR1 mRNA in ex vivo sorted cortical microglia from IFNAR1fl/fl or IFNAR1fl/fl LysMcre mice. **p < 0.01 compared with IFNAR1fl/fl. n = 9 mice, 3 separate ex vivo flow cytometry preparations.
Figure 2.
Figure 2.
Schematic diagram showing combined in vivo/ex vivo IPC experimental paradigm. WT, TLR4−/−, IFNAR1−/−, IFNAR1fl/fl, or IFNAR1fl/fl LysMcre 12- to 14-week-old male mice (all on C57BL/6 background) were subjected to either 15 min CCAO (our IPC pulse) or sham surgery. Seventy-two hours later, mice were killed by CO2 exposure and MONs were dissected out and placed in an interface perfusion chamber. Electrodes were put in place, and MONs were allowed to equilibrate in control conditions for 60 min, followed by 45 min exposure to OGD. Oxygen and glucose were then restored to baseline levels. CAPs were monitored before, during, and after OGD (for details, see Materials and Methods). After 5 h in normoxic/normoglycemic control (“recovery”) conditions, selected MONs were collected and processed for immunohistochemistry (A). The experimental groups are named in bold font according to the following: (1) position of the MON in question relative to CCAO surgery (i.e., ipsilateral or contralateral); (2) their initial in vivo exposure (i.e., sham surgery or CCAO); and (3) their subsequent ex vivo exposure [i.e., control (Con) or OGD] (B). IHC, Immunohistochemistry.
Figure 3.
Figure 3.
Axon function in WT MONs is improved after IPC. Seventy-two hours after IPC pulse, axon function in MONs from WT mice was assessed. MONs were allowed to equilibrate for 30–60 min to establish a baseline (see time point a). Axons were stimulated every 30 s with a supramaximal pulse; CAPs were quantified. Error bars are shown for every 10 data points. Ischemia was induced by OGD. After 45 min of OGD, normoxic/normoglycemic control conditions were returned for a period of several hours to monitor recovery (see time point b). Insets demonstrate a typical CAP at baseline (a) and during recovery (b) in both ipsilateral preconditioned (red) and contralateral control (blue) MONs. Calibration: insets in A, 1 mV, 0.5 ms. Bar graph showing extent of CAP recovery at 60 min after the end of 45 min OGD pulse (time point b). **p < 0.01. n = 11 MONs per group.
Figure 4.
Figure 4.
IPC attenuates axonal degradation after OGD. Axons were fixed and stained for SM-31 (green), an antibody that binds phosphorylated neurofilaments, as well as the nuclear marker DAPI (blue). The 40× objective images in A were obtained with an immunofluorescent microscope as described in Materials and Methods. Higher-magnification images in B are digital zoom. Axonal morphology was quantified systematically as described in Materials and Methods (maximum possible score is 12). IPC pulse alone did not significantly alter axonal morphology, but after OGD, there was a significant increase in the amount of axonal injury. Arrows indicate head/bulb formation in the injured fields after OGD (right panels in A). Axonal integrity after OGD was significantly greater in the Ipsi-OGD (7.5 ± 0.5) versus Contra-OGD (4.8 ± 0.4) MONs; **p < 0.01 (C). Scale bars: A, ∼30 μm; B, ∼8 μm. n = 3 MONs per group.
Figure 5.
Figure 5.
IPC attenuates formation of pyknotic nuclei in MONs after OGD. MONs were stained for the nuclear marker DAPI. The 40× objective images in A were obtained with an immunofluorescent microscope as described in Materials and Methods. The number of pyknotic nuclei were quantified as described in Materials and Methods. IPC pulse alone did not significantly alter the baseline number of pyknotic nuclei (left column in A, quantified in left two bars in B): Contra-con was 7 ± 1% and Ipsi-con was 6 ± 1%. However, after OGD, there was a significant increase in the number of pyknotic nuclei (right column in A, right two bars B) that was more pronounced on the non-preconditioned side: Contra-OGD, 33 ± 3% versus Ipsi-OGD, 25 ± 2%; **p < 0.01. Arrows indicate clumping of chromatin/pyknotic nuclei in the injured fields after OGD (right column in A). Scale bar, ∼15 μm. n = 3 MONs per group.
Figure 6.
Figure 6.
IPC attenuates OGD-induced oligodendrocyte loss in MONs. MONs were stained (green) with APC, an oligodendrocyte marker, and the nuclear marker DAPI (blue). The 40× objective images in A were obtained with an immunofluorescent microscope as described in Materials and Methods. Higher-magnification images in B are digital zoom. The number of APC+ cells were quantified as described in Materials and Methods. IPC pulse alone did not significantly alter the baseline number of oligodendrocytes (left columns in A and B, quantified in left two bars in C): Contra-con was 64 ± 4% and Ipsi-con was 61 ± 3%. However, after OGD, there was a significant decrease in the number of APC+ cells (right columns in A and B, right two bars in C). The number of APC+ cells after OGD was reduced more in the non-preconditioned side: Contra-OGD, 6 ± 3% versus Ipsi-OGD, 19 ± 4%; *p < 0.05. Scale bars: A, 60 μm; B, 15 μm. n = 3 MONs per group.
Figure 7.
Figure 7.
IPC did not change the amount of glutamate or aspartate released, nor did it alter AMPA glutamate receptor expression. As expected, OGD for 60 min was associated with a time-dependent increase in glutamate (A) and aspartate (B) release from optic nerve. However, there was no significant difference in release of either glutamate or aspartate from the Ipsi-OGD and Contra-OGD optic nerves at any time point during or after OGD. Samples of extracellular perfusate, ACSF, were collected every 2 min and assessed for amino acid concentrations by HPLC (see Materials and Methods). C and D show data for glutamate and aspartate release, respectively, reorganized into 20 min epochs (mean ± SE), n = 5; release magnitude compared with control/baseline (first 20 min); * over bar indicates a statistically significant release compared with baseline (noted by dashed line). *p < 0.05; **p < 0.01; ***p < 0.001 by ANOVA with Dunnett's post hoc test against 20 min of corresponding basal level release before OGD application. Preconditioned (Ipsi-OGD) and non-preconditioned (Contra-OGD) control displayed no significant differences in either glutamate or aspartate release before, during, or after OGD (Student's t test). Several representative nonsignificant p values are shown. n = 4 MONs per group. In E, the effects of IPC on expression of AMPA GluR mRNA subtypes/isoforms is shown. qRT-PCR on RNA extracted from either ipsilateral or contralateral MONs 72 h after 15 min CCAO, our IPC pulse. Findings are presented as log10 fold change in steady-state levels of each AMPA GluR subtype/isoform mRNA gene of interest (GOI) relative to panel of housekeeping genes (HKG) as described in Materials and Methods. Bar graph shows that six of the eight GluR subtypes/isoforms could be detected by qRT-PCR. IPC did not significantly alter expression of any of these transcripts at the 72 h time point (Student's t test). n = 3 qRT-PCR experiments on pooled samples from a total of 9 MONs per group.
Figure 8.
Figure 8.
IPC failed to protect WM against ischemic injury in TLR4−/−, IFNAR1−/−, or myeloid cell-specific IFNAR1 knockdown MONs. Seventy-two hours after IPC pulse (15 min CCAO), MONs were removed and exposed to a standardized ischemic insult: 45 min of OGD (see Materials and Methods). Recovery from OGD was determined 60 min after reperfusion with control solution (time point b). For the TLR4−/− mice, recovery of CAP was similar in Contra-OGD (21 ± 5%) and Ipsi-OGD (23 ± 4%; p = NS) MONs (A). For the IFNAR1−/− mice, recovery of CAP was also similar in Contra-OGD (17 ± 5%) and Ipsi-OGD (14 ± 3%; p = NS) MONs (B). n = 8 and 5 MONs per group for TLR4−/− and IFNAR1−/−, respectively. For the IFNAR1fl/fl control mice, recovery of CAP was significantly less in Contra-OGD (25 ± 6%) compared with Ipsi-OGD (45 ± 3%; *p < 0.05) MONs (C, E). For the IFNAR1fl/fl LysMcre mice, recovery of CAP was similar in Contra-OGD (25 ± 4%) and Ipsi-OGD (24 ± 3%; p = NS) MONs (D, F). n = 4 MONs per group for IFNAR1fl/fl control and IFNAR1fl/fl LysMcre, respectively.
Figure 9.
Figure 9.
Hypothesized pathway of IPC in CNS WM. IPC in WM is initiated by a brief (15 min) CCAO ischemic pulse (1). This leads to the extracellular release of DAMP macromolecules from multiple cellular (astrocytes, microglia) and possibly other (axons, myelin sheaths) sources (2). There likely are a variety of DAMP macromolecules involved, but specific examples might include heat shock proteins, peroxiredoxins, high mobility group box 1, and fibronectin. These DAMP macromolecules then bind to TLRs on the cell surface, including TLR4. In WM, TLR4 is found on microglia (3a) and astrocytes (3b). Binding of these receptors induces production of type 1 interferons, including IFNα and IFNβ, which are then secreted from the cells (4). INFα/β can then bind to the type 1 interferon receptor (a heterodimer that includes IFNAR1) on nearby microglia (5). This induces activation of IRFs and the transcription of ISGs in the microglia (6). Secreted ISG products (such as the chemokines CXCL10 and CCL5) are released from the cell (7a), and intracellular ISGs may alter the microglial phenotype (7b). ISG expression ultimately leads to protection of oligodendrocytes and their associated myelin and enhances functional recovery to subsequent ischemic exposure (8).

Similar articles

Cited by

References

    1. Adams JH, Graham DI, Gennarelli TA. Head injury in man and experimental animals: neuropathology. Acta Neurochir Suppl (Wien) 1983;32:15–30. doi: 10.1007/978-3-7091-4147-2_2. - DOI - PubMed
    1. Alix JJ, Fern R. Glutamate receptor-mediated ischemic injury of premyelinated central axons. Ann Neurol. 2009;66:682–693. doi: 10.1002/ana.21767. - DOI - PubMed
    1. Bahjat FR, Williams-Karnesky RL, Kohama SG, West GA, Doyle KP, Spector MD, Hobbs TR, Stenzel-Poore MP. Proof of concept: pharmacological preconditioning with a Toll-like receptor agonist protects against cerebrovascular injury in a primate model of stroke. J Cereb Blood Flow Metab. 2011;31:1229–1242. doi: 10.1038/jcbfm.2011.6. - DOI - PMC - PubMed
    1. Bakiri Y, Hamilton NB, Káradóttir R, Attwell D. Testing NMDA receptor block as a therapeutic strategy for reducing ischaemic damage to CNS white matter. Glia. 2008;56:233–240. doi: 10.1002/glia.20608. - DOI - PMC - PubMed
    1. Baltan S, Besancon EF, Mbow B, Ye Z, Hamner MA, Ransom BR. White matter vulnerability to ischemic injury increases with age because of enhanced excitotoxicity. J Neurosci. 2008;28:1479–1489. doi: 10.1523/JNEUROSCI.5137-07.2008. - DOI - PMC - PubMed

Publication types