. 2015 Nov 25:6:8864.
doi: 10.1038/ncomms9864.

miRNA-target chimeras reveal miRNA 3'-end pairing as a major determinant of Argonaute target specificity

Affiliations

miRNA-target chimeras reveal miRNA 3'-end pairing as a major determinant of Argonaute target specificity

Michael J Moore et al. Nat Commun. .

Abstract

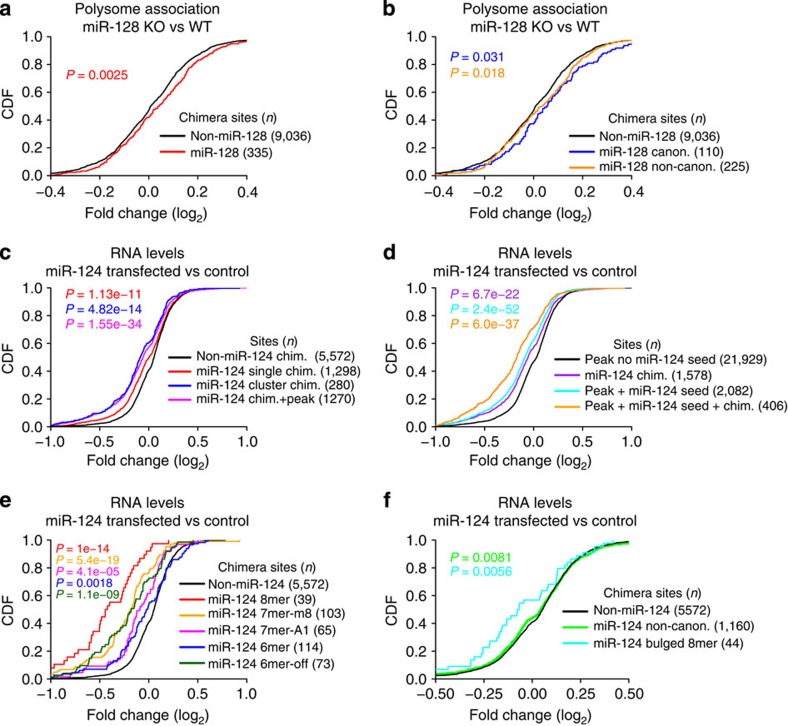
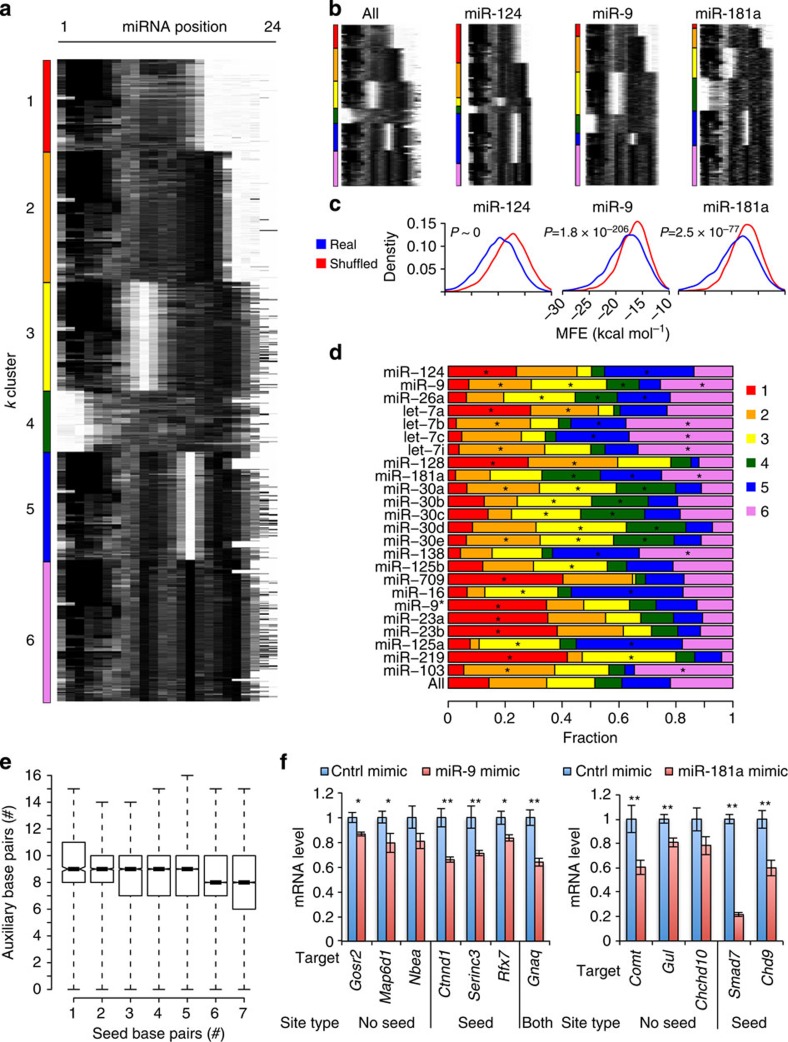
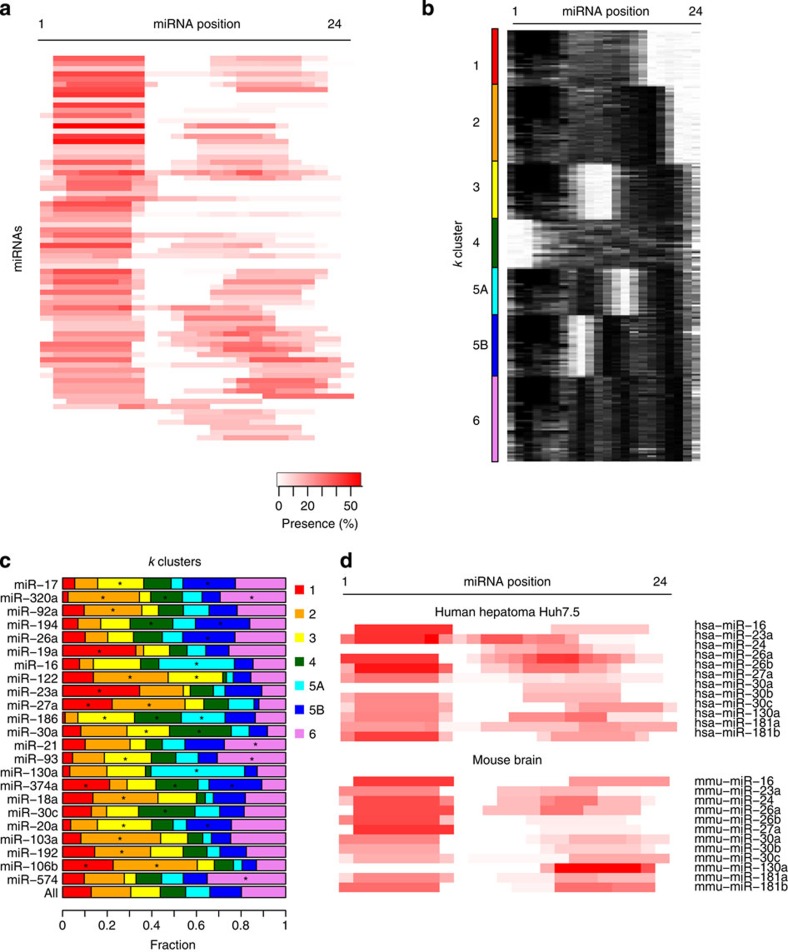
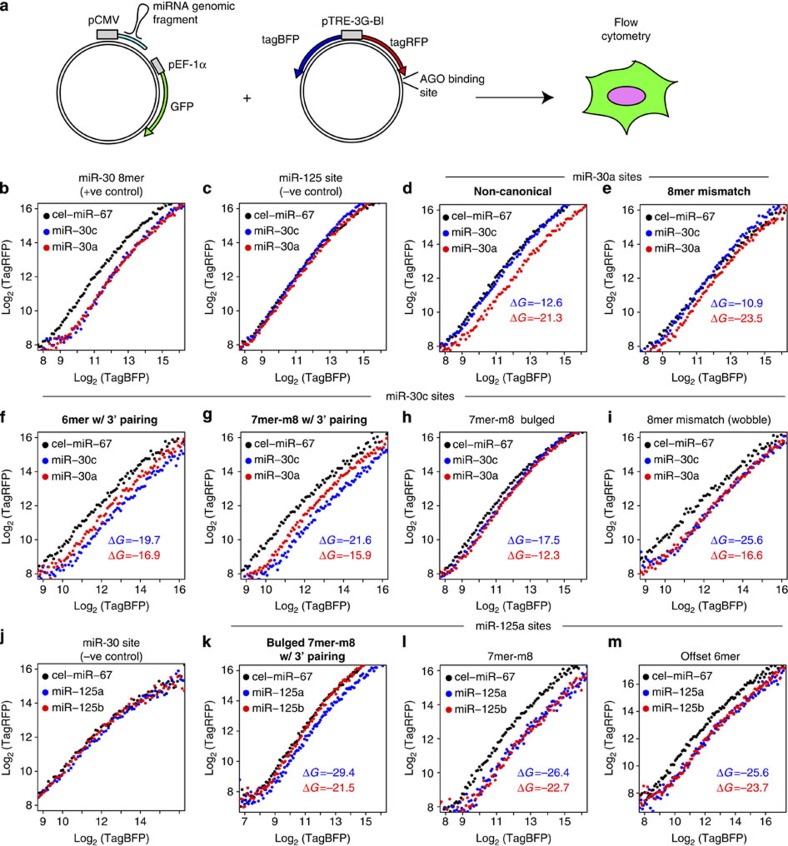
microRNAs (miRNAs) act as sequence-specific guides for Argonaute (AGO) proteins, which mediate posttranscriptional silencing of target messenger RNAs. Despite their importance in many biological processes, rules governing AGO-miRNA targeting are only partially understood. Here we report a modified AGO HITS-CLIP strategy termed CLEAR (covalent ligation of endogenous Argonaute-bound RNAs)-CLIP, which enriches miRNAs ligated to their endogenous mRNA targets. CLEAR-CLIP mapped ∼130,000 endogenous miRNA-target interactions in mouse brain and ∼40,000 in human hepatoma cells. Motif and structural analysis define expanded pairing rules for over 200 mammalian miRNAs. Most interactions combine seed-based pairing with distinct, miRNA-specific patterns of auxiliary pairing. At some regulatory sites, this specificity confers distinct silencing functions to miRNA family members with shared seed sequences but divergent 3'-ends. This work provides a means for explicit biochemical identification of miRNA sites in vivo, leading to the discovery that miRNA 3'-end pairing is a general determinant of AGO binding specificity.


Figures

Figure 1
Figure 1. CLEAR-CLIP unambiguously identifies endogenous in vivo miRNA–target interactions.
(a) In CLEAR-CLIP, AGO–target contacts are cross-linked in vivo by ultraviolet irradiation. Endogenous AGO is immunopurified from tissue lysates and washed under stringent conditions that disrupt the interaction of AGO–miRNA with non-cross-linked target RNAs. Target regions cannot be cloned from no-ultraviolet controls, indicating that cross-linking of AGO to target mRNA (shown as ‘X') is required. Cross-linking of the miRNA may not be necessary, because the AGO–miRNA interaction is uniquely strong and survives stringent washing. After washing, RNA ends are modified to facilitate miRNA–target ligation and joined with T4 RNA Ligase I treatment, yielding miRNA–target chimeric RNAs in two orientations at the indicated frequencies. All depicted post-IP manipulations up to SDS–PAGE occur on beads. Correlation plots of miRNA abundance of all miR-first (b) and miR-last (c) chimeras versus small RNA sequencing data in the brain. Pearson's correlation coefficients (r) are shown. CDF plots of cognate miRNA seed matches in target regions relative to ligation site for all miR-first chimeras in plus-ligase (d) and no-ligase (e) samples, and for all miR-last chimeras in plus-ligase (f) and no-ligase (g) samples. (h) Distribution of standard AGO CLIP and miRNA–target chimeras in transcript regions. (i) CLEAR-CLIP confirmed known miRNA regulation, here exemplified by miR-124 regulation of the Ptbp1 3′-UTR. Other examples are shown in Supplementary Fig. 3c.
Figure 2
Figure 2. miRNA–target chimeras identify functional interactions.
(a) Polyribosome association in miR-128 KO versus WT mouse brain plotted as a CDF for 3′-UTR sites identified with miR-128 chimeras (red) and non-miR-128 3′-UTR chimeras (black). (b) CDF as in a shown for canonical (blue) and non-canonical (orange) miR-128 sites. (c) Fold change in mRNA levels in CAD cells transfected with miR-124 mimic versus control are plotted as a CDF for 3′-UTR sites identified with miR-124 chimeras in the brain. miR-124 sites identified once (red), multiple times (blue) or overlapping AGO CLIP peaks (magenta) are shown compared with non-miR-124 sites (black). (d) CDF of 3′-UTR miR-124 sites as in c, showing miR-124 sites identified with chimeras (violet), peaks overlapping miR-124 seed matches (cyan) or peaks overlapping both seeds and miR-124 chimera(s) (orange). (e) CDF plots for transcripts with only chimera-defined canonical 3′-UTR miR-124 sites, broken down by site type. (f) CDF as in e for all 3′-UTR non-canonical sites (green) and bulged 8mer sites (cyan). In all panels, P-values from Kolmogorov–Smirnov testing comparing coloured subsets with control (black) sites are shown, along with the number of sites (n) in each set.
Figure 3
Figure 3. Motif analysis reveals miRNA binding dependent on seed and auxiliary pairing.
The proportion of chimera-defined target regions with the indicated seed variants is plotted, broken down (a) by transcript region, (b) by the number of times interactions were identified with chimeras (N) or whether chimeras overlapped AGO CLIP peaks and (c) for the most abundant miRNA families in mouse brain, ranked from the top by decreasing abundance. (d) Overlap of 3′-UTR chimera-identified sites in the brain with TargetScan predicted sites for the same miRNA (red) or three equally sized random control sets of TargetScan sites (black). Control sets were restricted to the top 20 brain miRNAs. Only target sites in mRNAs with detectable expression in the cortex were considered. (e) The distributions of mismatched and bulged nucleotides for chimera-identified sites with imperfect seed motifs are plotted for the top 25 mouse brain miRNAs (black), miR-124 (red) and miR-9 (blue). Error bars show the s.d. at each position for the top 25 miRNAs in the brain. miRNA seed sequences for miR-124 and miR-9 are shown below mismatch and miRNA bulge plots. Below the target bulge plot, the most frequently bulged target nucleotide at the indicated position is shown when strong preferences (>50% of sites) were apparent. Sites from all transcript regions were included in this analysis. (f) De novo analysis of cognate miRNA-complementary-enriched 7mer motifs in all chimera target regions plotted as a heat map across the miRNA. Each line represents one miRNA and colour intensity scales with abundance in target sequences. miRNAs are ordered by hierarchical clustering.
Figure 4
Figure 4. Duplex structure prediction reveals diverse targeting patterns for brain miRNAs.
(a) RNAhybrid miRNA–target duplex structure predictions represented as heat maps. Black pixels indicate base pairing and white pixels indicate gaps. Structures were partitioned by k-means clustering into six groups (see Methods). Interactions from all transcript regions were included in this analysis. (b) Structure maps for individual miRNAs compared with all. (c) Density plots of duplex minimum free energies (MFEs) are shown for the indicated miRNA–target interactions (blue) or shuffled interactions (red), where each chimeric target region was randomly re-assigned to an miRNA from a different chimeric interaction. MFEs were calculated with RNAhybrid. Axis labels are printed once, but apply to all plots. P-values from two-tailed t-tests are shown. (d) Distributions of the six identified k-clusters for the top brain miRNAs, ranked by decreasing abundance from the top to the bottom. Most brain miRNAs (∼90%) and all shown here have significant preferences versus the whole population (*positive enrichment, P<10−3, Fisher's exact test; full set is in Supplementary Table 3). (e) Box plot comparing number of predicted seed region base pairs with predicted auxiliary base pairs for all brain miRNA–target chimeras. (f) Experimental validation of chimera-identified seed-dependent and seedless (k=4, with no canonical seeds in 3′-UTR) miR-9 and miR-181a targets was performed by transfecting miRNA mimics into N2A cells and measuring endogenous targets by qRT–PCR. The average fold change in miRNA mimic versus control mimic-transfected cells is shown from four independent transfections, ±s.e.m. *P<0.05 and **P<0.01, one-tailed t-test. Smad7, a previously confirmed miR-181a target, served as a positive control.
Figure 5
Figure 5. miRNA–target chimeras identify functional interactions in Huh-7.5 cells.
CDF seed-enrichment plots as in Fig. 1d–g for miR-first (a) and miR-last (b) chimera target regions from Huh-7.5 HITS-CLIP. CDF plots of LNA-122 induced changes in AGO binding across 3′-UTRs (c) or all regions (d) for sites with miR-122 7-8mer seeds (magenta), miR-122 chimeras (red) or the combination of both (blue). P-values are shown for Kolmogorov–Smirnov tests comparing indicated subsets to control (black) sets. (e) miR-first and miR-last chimeras in CLEAR-CLIP on Huh-7.5 cells as a percentage of total unique reads, varying the presence of exogenous T4 RNA ligase and RNAse. For HSPC117 ligase, (+) represents endogenous levels, (−) represents siRNA knockdown and (++) represents overexpression as shown in Supplementary Fig. 8d. (f) Analysis of CLEAR-CLIP derived miR-first chimera truncation and the effects of HSPC117 manipulation. Percentage of chimeras harbouring full-length miRNAs was compared with chimeras with the indicated 3′-truncations, or with all putative chimeric reads with at least 12 nts miRNA sequence starting at the 5′-miRNA end. In e,f, the mean values of two biological replicates is shown for each sample, with error bars indicating s.d.
Figure 6
Figure 6. Expanded miRNA pairing rules for human miRNAs.
(a) De novo analysis of cognate miRNA-complementary-enriched 7mer motifs in chimera target regions plotted as a heat map across the miRNA. Each line represents one miRNA, with colour intensity indicating abundance in target sequence. miRNAs are ordered by hierarchical clustering. Interactions from all Huh-7.5 HITS-CLIP and CLEAR-CLIP experiments from all transcript regions were included in these analyses. (b) RNAhybrid miRNA–target duplex structure predictions represented as heat maps as in Fig. 4a, partitioned by k-means clustering. (c) Distributions of the seven identified k-clusters for top Huh-7.5 miRNAs ranked by abundance in chimeras from top to bottom. Most miRNAs (∼90%) and all shown here have distinct preferences versus the whole population. Interactions from all transcript regions were included in this analysis (*positive enrichment, P<10−3, Fisher's exact test; full results in Supplementary Table 5). (d) Comparative motif analysis heat map for the 12 miRNAs that were among the 50 most abundant in both mouse brain and Huh-7.5 cells.
Figure 7
Figure 7. CLEAR-CLIP reveals target specificity among miRNA family members.
Base pairing profiles from duplex structure maps for let-7 (a) and miR-30 (b) family members are shown. For each miRNA, the fraction of interactions with base pairing at each miRNA position is plotted. miRNA sequences are shown below with coloured bases indicating divergent nucleotides. De novo motif analysis of target regions for indicated miRNAs revealed family-member-specific motifs complementary to divergent parts of the miRNAs. For easier interpretation, the target motifs were reverse complemented to match the miRNA sequences. P-values for enrichment over background (AGO-binding regions in brain) from HOMER are indicated. No unique auxiliary motif was found for let-7a, the only such case. (c,d) Predicted minimum free energies (MFEs) from pairwise analysis of duplex structures for chimera-defined targets and the indicated let-7 (c) or miR-30 (d) family members is shown. Targets paired with their chimera-identified, cognate let-7 family member are shaded darker. Interactions from all transcript regions were included in these analyses. Box plots depict interquartile (25–75) values (*P<0.05, **P<0.001, ***P<10−10 and ****P<10−50, one-tailed t-test).
Figure 8
Figure 8. miRNA family member specificity confirmed by single cell measurements.
(a) A system for single cell measurements of miRNA-mediated repression, adapted from ref. . tagRFP and tagBFP are expressed from the doxycycline-inducible bidirectional pTRE-3G-BI promoter. CLEAR-CLIP-defined AGO-binding sites were cloned into the 3′-UTR of the tagRFP cassette, with tagBFP used for internal normalization. Plasmids co-expressing miRNAs and GFP were co-transfected and measurements were taken 48 h later. (bm) Log-transformed plots of tagRFP versus tagBFP fluorescence, with minimum free energies (MFEs) (ΔG) for predicted base pairing between duplex structures for indicated paralogues. A description of the site type is shown above each plot, with bold labelling denoting successful validation of paralogue specificity. Evaluation of miR-30a (red), miR-30c (blue) and negative control miRNA (black) overexpression on (b) a full miR-30 8mer site as a positive control for miR-30 paralogues; (c) a miR-125 site as a negative control for miR-30 paralogues; (d,e) sites with predicted miR-30a preference; and (fi) sites with predicted miR-30c preference. Evaluation of miR-125a (blue), miR-125b (red) and negative control miRNA (black) overexpression on (j) a miR-30 site as a negative control for miR-125 paralogs and (km) sites with predicted miR-125a preference. Representative plots from at least two independent experiments for each construct are shown.

Similar articles

Cited by

References

    1. Fabian M. R., Sonenberg N. & Filipowicz W. Regulation of mRNA translation and stability by microRNAs. Annu. Rev. Biochem. 79, 351–379 (2010). - PubMed
    1. Tan C. L. et al.. MicroRNA-128 governs neuronal excitability and motor behavior in mice. Science 342, 1254–1258 (2013). - PMC - PubMed
    1. Im H. I. & Kenny P. J. MicroRNAs in neuronal function and dysfunction. Trends Neurosci. 35, 325–334 (2012). - PMC - PubMed
    1. Mizoguchi M. et al.. MicroRNAs in human malignant gliomas. J. Oncol. 2012, 732874 (2012). - PMC - PubMed
    1. Setty M. et al.. Inferring transcriptional and microRNA-mediated regulatory programs in glioblastoma. Mol. Syst. Biol. 8, 605 (2012). - PMC - PubMed

Publication types