. 2016 Jan 22;291(4):1933-1947.
doi: 10.1074/jbc.M115.691972. Epub 2015 Nov 24.

Nuclear Factor of Activated T Cells-dependent Down-regulation of the Transcription Factor Glioma-associated Protein 1 (GLI1) Underlies the Growth Inhibitory Properties of Arachidonic Acid

Affiliations

Nuclear Factor of Activated T Cells-dependent Down-regulation of the Transcription Factor Glioma-associated Protein 1 (GLI1) Underlies the Growth Inhibitory Properties of Arachidonic Acid

Andrea Comba et al. J Biol Chem. .

Abstract

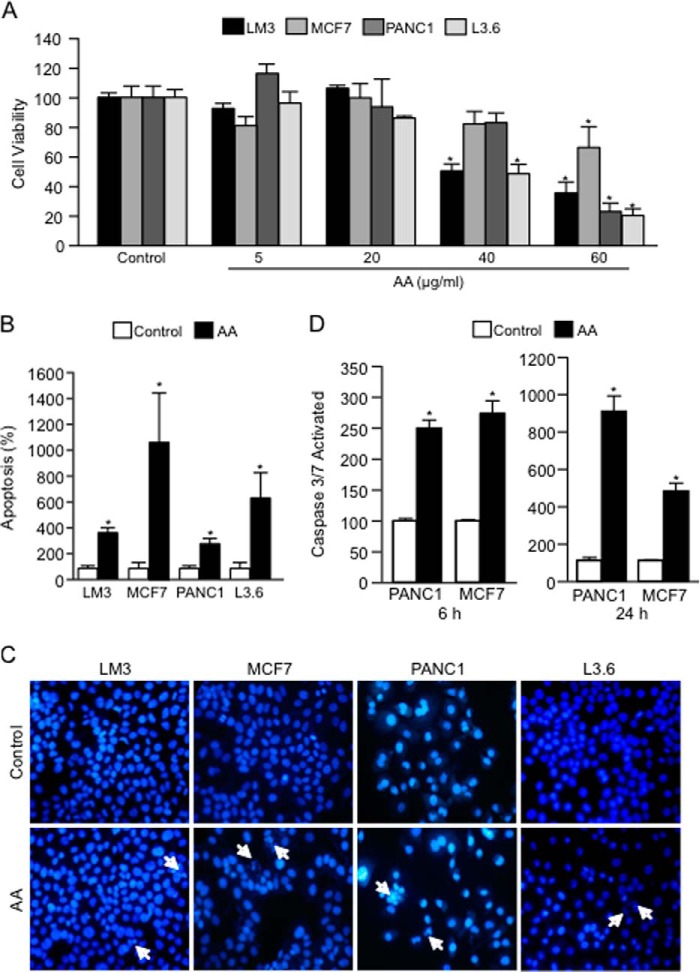
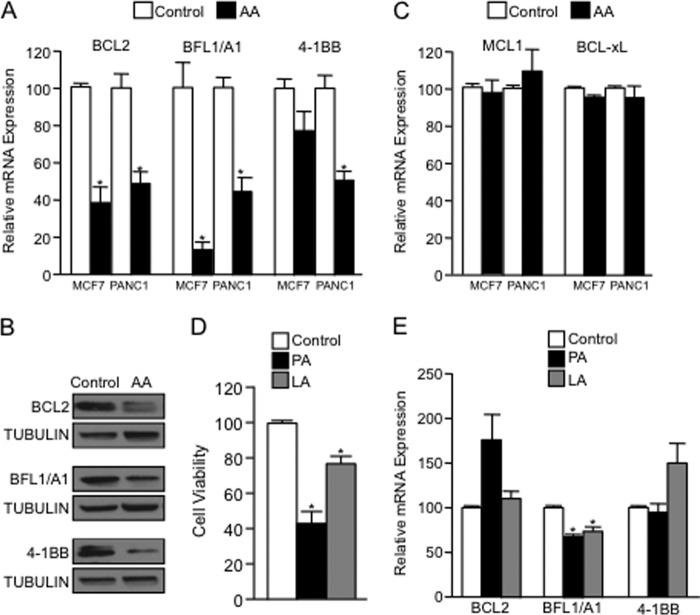
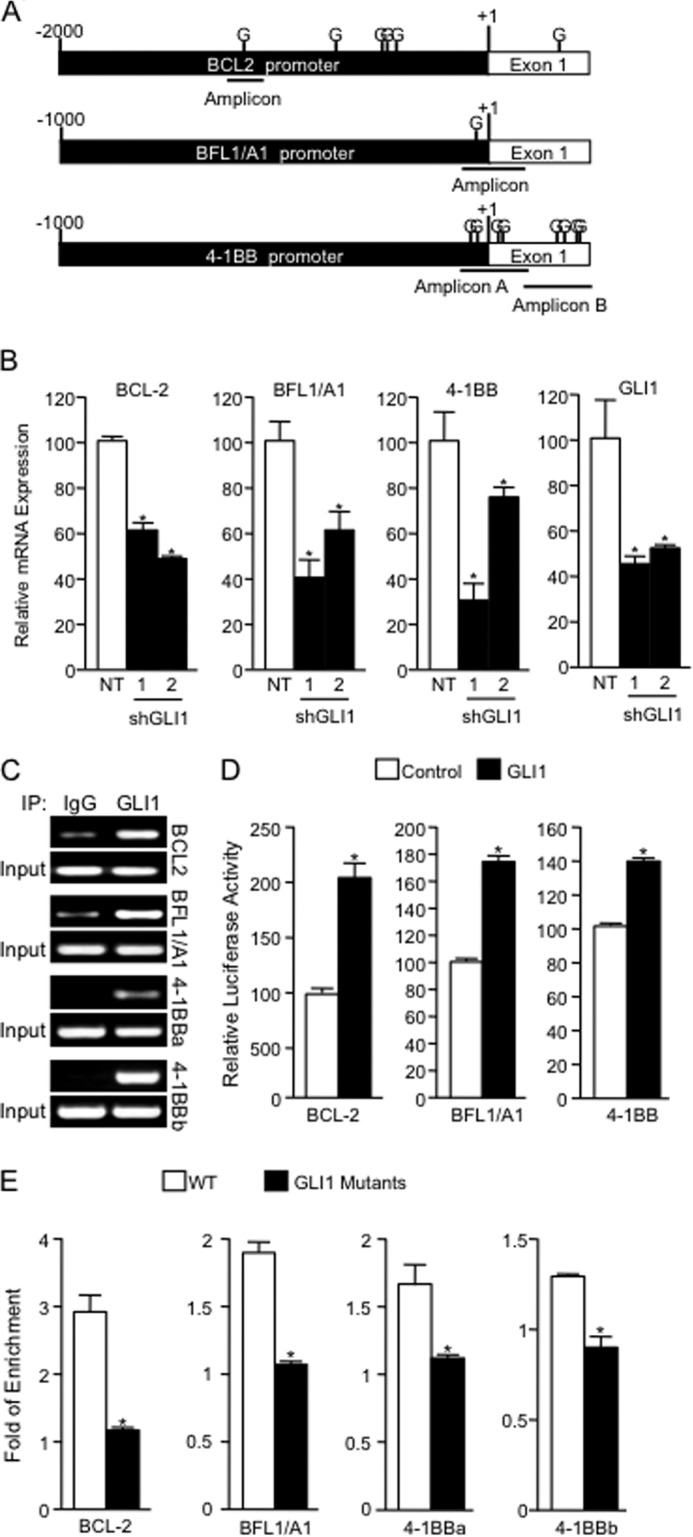
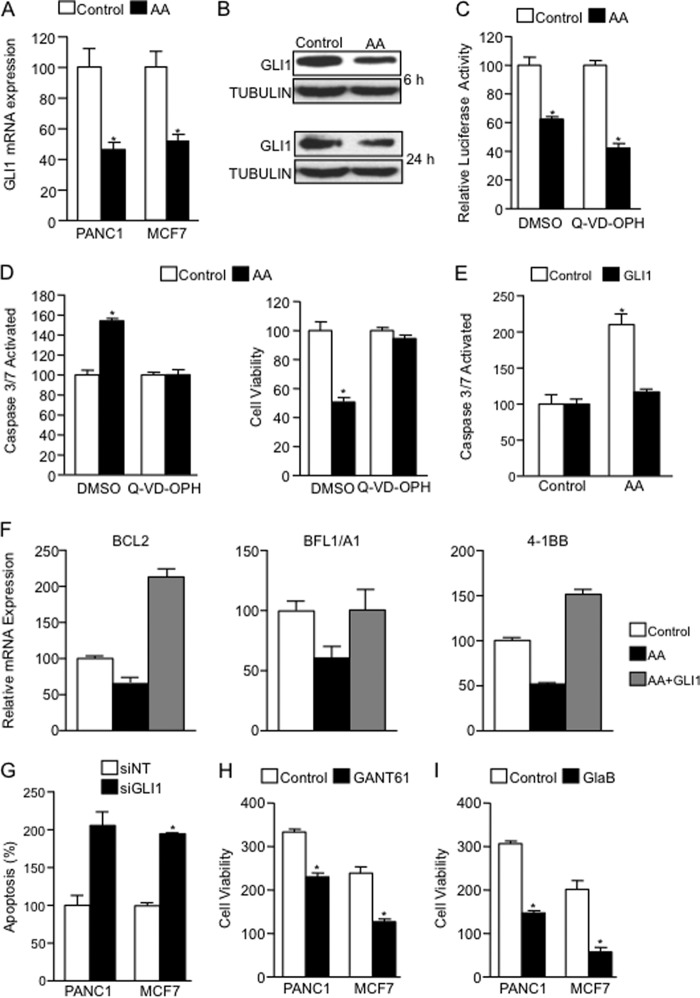
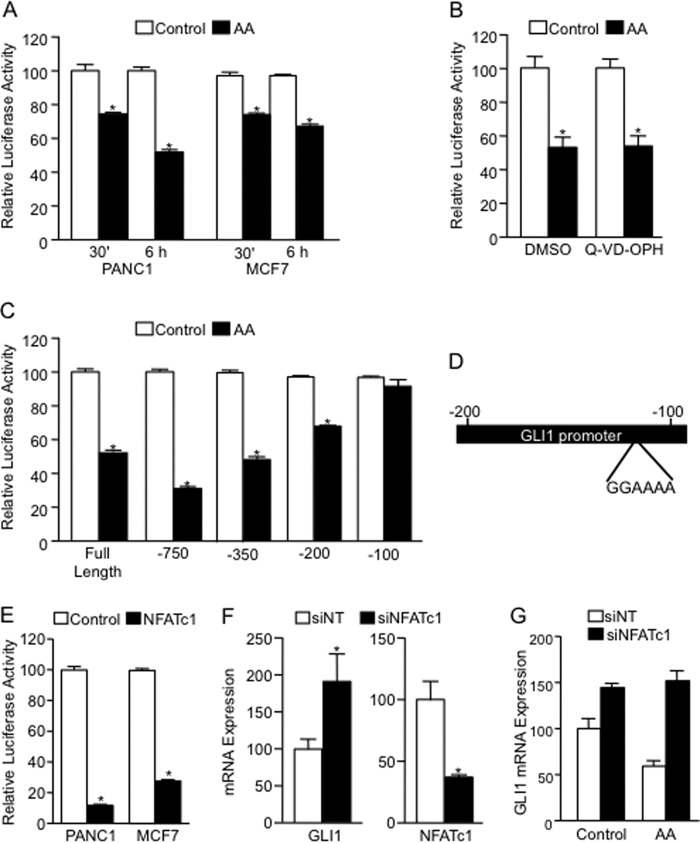
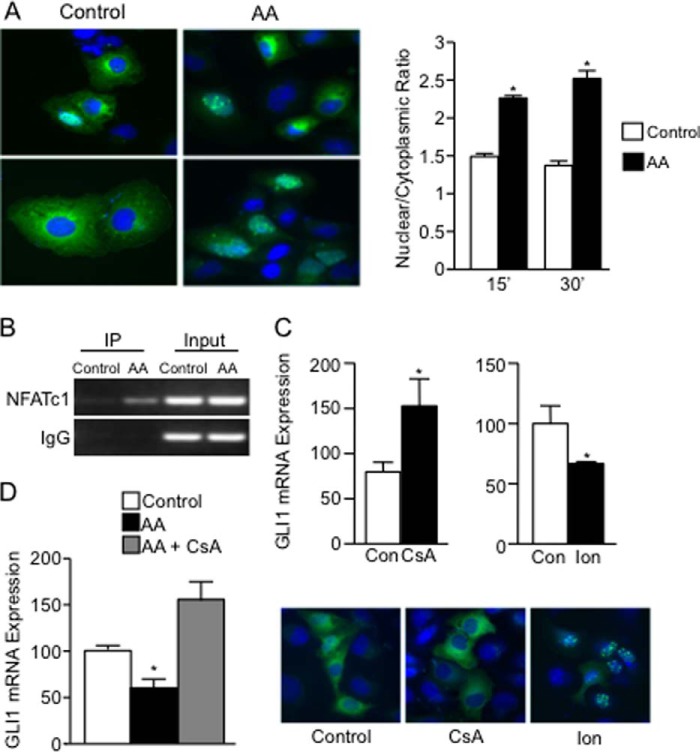
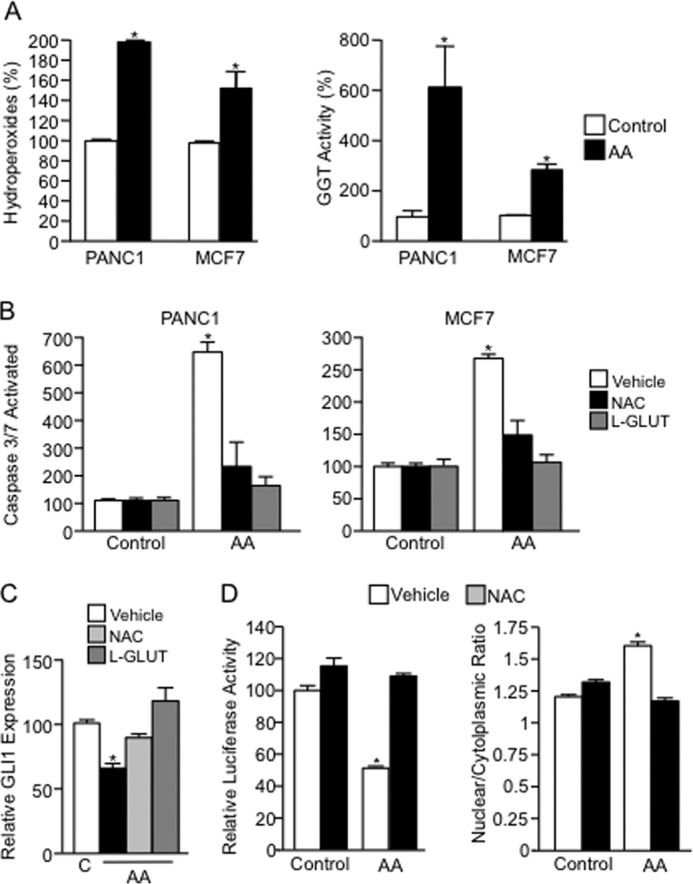
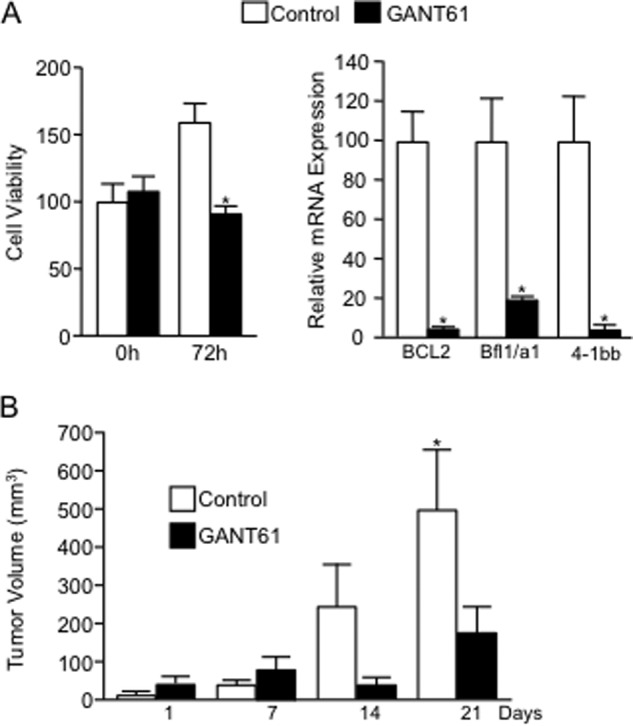
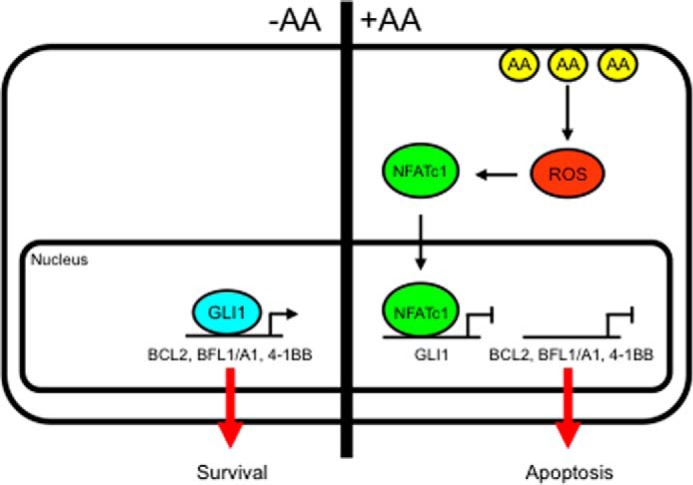
Numerous reports have demonstrated a tumor inhibitory effect of polyunsaturated fatty acids (PUFAs). However, the molecular mechanisms modulating this phenomenon are in part poorly understood. Here, we provide evidence of a novel antitumoral mechanism of the PUFA arachidonic acid (AA). In vivo and in vitro experiments showed that AA treatment decreased tumor growth and metastasis and increased apoptosis. Molecular analysis of this effect showed significantly reduced expression of a subset of antiapoptotic proteins, including BCL2, BFL1/A1, and 4-1BB, in AA-treated cells. We demonstrated that down-regulation of the transcription factor glioma-associated protein 1 (GLI1) in AA-treated cells is the underlying mechanism controlling BCL2, BFL1/A1, and 4-1BB expression. Using luciferase reporters, chromatin immunoprecipitation, and expression studies, we found that GLI1 binds to the promoter of these antiapoptotic molecules and regulates their expression and promoter activity. We provide evidence that AA-induced apoptosis and down-regulation of antiapoptotic genes can be inhibited by overexpressing GLI1 in AA-sensitive cells. Conversely, inhibition of GLI1 mimics AA treatments, leading to decreased tumor growth, cell viability, and expression of antiapoptotic molecules. Further characterization showed that AA represses GLI1 expression by stimulating nuclear translocation of NFATc1, which then binds the GLI1 promoter and represses its transcription. AA was shown to increase reactive oxygen species. Treatment with antioxidants impaired the AA-induced apoptosis and down-regulation of GLI1 and NFATc1 activation, indicating that NFATc1 activation and GLI1 repression require the generation of reactive oxygen species. Collectively, these results define a novel mechanism underlying AA antitumoral functions that may serve as a foundation for future PUFA-based therapeutic approaches.

Keywords: GLI1; arachidonic acid (AA) (ARA); cancer; cell death; polyunsaturated fatty acid (PUFA); transcription factor.


Figures

FIGURE 1.
FIGURE 1.
AA treatment induces apoptosis in vitro. A, LM3, MCF7, PANC1, and L3.6 cells were treated with the control vehicle (ethanol) or different concentrations of AA (5, 20, 40, and 60 μg/ml). Cells were treated for 24 h, and viability was determined by the fluorometric indicator dye resazurin to measure the metabolic capacity of cells. These cells show a significant reduction in viability after a treatment concentration of 60 μg/ml AA for MCF7 and PANC1 and 40 μg/ml AA for LM3 and L3.6 compared with controls. Bars and error bars represent means and S.E., respectively; n = 3. *, p < 0.05 versus control group. B and C, apoptosis was evaluated by fluorescence staining with Hoechst 33258 in cells treated for 24 h ±AA. B, cells were cultured in 6-well plates (2.5 × 10⁵ cells/well) and treated with 60 μg/ml AA for MCF7 and PANC1 and 40 μg/ml AA for LM3 and L3.6 cells. Apoptosis was measured by counting the number of apoptotic nuclei/total nuclei and normalizing the data by control values (control = 100%). Bars and error bars represent means and S.E., respectively; n = 3. *, p < 0.05 versus control group (EtOH). C, representative images showing increased apoptotic nuclei in AA-treated cells. Arrows indicate apoptotic nuclei. D, apoptosis was evaluated in MCF7 and PANC1 cells treated for 6 (left panel) and 24 h (right panel) by Apo-ONE homogeneous CASP3/7 assay. Cells were plated at 5 × 10⁴ cells/well in 96-well plates. Fluorescent signals were measured at a wavelength of 485 nm excitation/527 nm emission). Bars and error bars represent means and S.E., respectively; values are normalized by control values (control = 100%); n = 5. *, p < 0.05 versus control group (EtOH).
FIGURE 2.
FIGURE 2.
AA decreases antiapoptotic BCL2, BFL1/A1, and 4-1BB expression. A, BCL2, BFL1/A1, and 4-1BB mRNA expression levels were determined by RT-q-PCR. PANC1 and MCF7 cells were treated ±AA (60 μg/ml) or the control vehicle for 6 h. Bars and error bars represent means and S.E., respectively; n = 3. *, p < 0.05 versus control group (EtOH). B, immunoblotting analysis showed lower levels of BCL2, BFL1/A1, and 4-1BB protein expression in MCF7 cells treated with AA compared with the vehicle control at 6 h post-treatment. C, expression of MCL1 and BCL-xL were determined by q-PCR in PANC1 and MCF7 cells treated with vehicle or AA (60 μg/ml). D, PANC1 cells were treated with the control vehicle (ethanol), PA, or LA (both at 60 μg/ml). Cells were treated for 24 h, and viability was determined by the fluorometric indicator dye resazurin. These cells show a significant reduction in viability after PA and LA treatments. Bars and error bars represent means and S.E., respectively; n = 3. *, p < 0.05 versus control group. E, expression of the indicated genes in PANC1 cells treated with PA and LA was determined as described in A.
FIGURE 3.
FIGURE 3.
BCL2, BFL1/A1, and 4-1BB are direct targets of the transcription factor GLI1. A, bioinformatics analysis of the BCL2, BFL1/A1, and 4-1BB promoters identified candidate GLI (G) binding sites upstream of their first exon. B, PANC1 cells transfected with two different shRNA vectors targeting GLI1 (shGLI1 and shGLI2) and a non-targeting control vector (NT) were examined for BCL2, BFL1/A1, and 4-1BB mRNA expression levels by q-PCR. Bars and error bars represent means and S.E., respectively; n = 3. *, p < 0.05 versus non-targeting control. C, PANC1 cells were lysed, and a ChIP assay was performed using a GLI1 antibody (GLI1) or IgG control (IgG). PCR was performed using specific sets of primers for BCL2, BFL1/A1, and 4-1BB promoter regions as indicated under “Experimental Procedures.” IP, immunoprecipitation. D, relative changes in luciferase activity in PANC1 cancer cells co-transfected with promoter reporter constructs of the antiapoptotic genes (BCL2, BFL1/A1, and 4-1BB) and with the GLI1 expression constructs or control vector. Data are mean ± S.E.; n = 3. *, p < 0.05 versus the control group. E, transient ChIP assay in PANC1 cells transfected with the WT BCL2, BFL1/A1, and 4-1BB promoter reporter constructs or mutants lacking GLI1 binding sites. Bars and error bars represent means and S.E., respectively; n = 3. *, p < 0.05 versus the control group.
FIGURE 4.
FIGURE 4.
AA decreases GLI1 expression. A, GLI1 mRNA expression levels were determined by real time RT-PCR in PANC1 and MCF7 cells treated with AA (60 μg/ml) or the control vehicle for 3 h. Bars and error bars represent means and S.E., respectively; n = 3. *, p < 0.05 versus control group (EtOH). B, Western blot analysis shows that AA decreases GLI1 protein expression at 6 and 24 h post-treatment. C, relative changes in luciferase activity in PANC1 cancer cells transfected with a GLI-LUC reporter and subsequently treated with the CASP inhibitor Q-VD-OPH at 20 μm or the control vehicle DMSO and co-treated with AA (60 μg/ml) or control vehicle (EtOH) for 6 h. Bars and error bars represent means and S.E., respectively; n = 3. *, p < 0.05 versus control group. D, apoptosis was measured by homogeneous CASP3/7 assay and viability was measured by resazurin assay in PANC1 cells treated with the CASP inhibitor Q-VD-OPH at 20 μm. Cells were subsequently co-treated with AA (60 μg/ml) or control vehicle for 6 h. Bars and error bars represent means and S.E., respectively; n = 3. *, p < 0.05 versus control group. E, PANC1 cells were transfected with the GLI1 expression construct or the control vector. After 24 h, transfected cells were treated with AA at 60 μg/ml or control vehicle (EtOH) for 6 h. A homogeneous CASP3/7 assay was performed to measure apoptosis. Bars and error bars represent means and S.E., respectively; n = 3. *, p < 0.05 versus control vector. F, mRNA expression of BCL2, BFL1/A1, and 4-1BB in PANC1 and MCF7 cells transfected with GLI1 expression construct and control vector and treated with AA at a concentration of 60 μg/ml. G, apoptosis was evaluated by fluorescence staining with Hoechst 33258 in PANC1 and MCF7 transfected with siRNA non-targeting (siNT) control and siGLI1. Cell viability was measured by resazurin assay (right panel) in PANC1 cells treated with GANT61 at 20 μm (H) or Glabrescione B (GlaB) (I) at 20 μm for 48 h. Bars and error bars represent means and S.E., respectively; n = 3. *, p < 0.05 versus control group.
FIGURE 5.
FIGURE 5.
AA represses GLI1 promoter activity in cancer cells. A, relative changes in luciferase activity in PANC1 (left) and MCF7 (right) cancer cells transfected with GLI1 promoter reporter vector and subsequently treated with AA (60 μg/ml) or control vehicle (EtOH) for 30 min (′) and 6 h. Bars and error bars represent means and S.E., respectively; n = 3. *, p < 0.05 versus the control group. B, relative changes in luciferase activity in PANC1 cancer cells transfected with a GLI1 promoter reporter and subsequently treated with the CASP inhibitor Q-VD-OPH at 20 μm or the control vehicle DMSO and co-treated with AA (60 μg/ml) or the control vehicle (EtOH) for 6 h. Bars and error bars represent means and S.E., respectively; n = 3. *, p < 0.05 versus the control group. C, relative luciferase activity in PANC1 cells transfected with a series of truncated GLI1 promoter reporter constructs and then treated with AA or control (EtOH). *, p < 0.05 versus the control group. D, diagram showing AA-responsive region and NFATc1 binding site within the GLI1 promoter. E, relative changes in luciferase activity in PANC1 and MCF7 cancer cells co-transfected with the GLI1 promoter reporter and with the NFATc1 expression constructs or PCMV control vector. Bars and error bars represent means and S.E., respectively; n = 3. *, p < 0.05 versus the control group. F, PANC1 cells transfected with an siRNA targeting NFATc1 or a non-targeting control (siNT) were examined for GLI1 and NFATc1 mRNA expression levels by real time RT-PCR. Bars and error bars represent means and S.E., respectively; n = 3. *, p < 0.05 versus non-targeting control. G, GLI1 mRNA and NFATc1 expression levels were determined by q-PCR in PANC1 transfected with a non-targeting (siNT) control and siRNA targeting NFATc1 and then treated with AA (60 μg/ml) or the control vehicle for 3 h. Bars and error bars represent means and S.E., respectively; n = 3 expressed as relative percentage to control. *, p < 0.05 versus control group (EtOH).
FIGURE 6.
FIGURE 6.
NFATc1 mediates AA silencing of GLI1 expression. A, PANC1 cells were transfected with an expression construct encoding NFATc1-GFP for 48 h and then treated with AA (60 μg/ml) or vehicle for 15 or 30 min. Cells were fixed, stained with DAPI, and then viewed by fluorescence microscopy. Left panel, two examples each of NFATc1-GFP fluorescence in 15-min control and AA-treated cells are shown. Green, NFATc1-GFP; blue, DAPI. Right panel, nuclear/cytoplasmic localization of NFATc1 was quantified by image analysis of micrographs as in A. n ≥ 40 cells for each condition. *, p < 0.05 versus the control group. B, ChIP assay was performed in PANC1 lyses cells pretreated with AA (60 μg/ml) or control vehicle (EtOH) for 6 h; NFATc1 antibody or IgG control antibody was used. PCR was performed using a specific set of primers indicated under “Experimental Procedures” for the −350 bp upstream GLI1 promoter region. IP, immunoprecipitation. C, PANC1 cells were treated for 3 h with 1 μm CsA or 0.5 μm ionomycin (Ion) for 15 min (′) or vehicle control (Con) and examined for GLI1 mRNA expression by q-PCR (upper panel). PANC1 cells transfected with NFATc1-GFP for 48 h were similarly treated with CsA, ionomycin, or vehicle and viewed by fluorescence microscopy (lower panel) to validate the effects of these treatments on NFATc1 localization. Green, NFATc1-GFP; blue, DAPI. D, PANC1 cells were treated for 1 h with CsA and then for 24 h with AA or control vehicle. RNA was isolated, and GLI1 mRNA expression was quantified by q-PCR. Bars and error bars represent means and S.E., respectively.
FIGURE 7.
FIGURE 7.
Involvement of reactive oxygen species in AA effects on GLI1 expression. A, hydroperoxides and γ-glutamyl transpeptidase (GGT) activity were measured in PANC1 and MCF7 cells treated ±AA. Activated CASP3/7 (B) and GLI1 mRNA expression (C) were measured in PANC1 and MCF7 cells pretreated with the antioxidants NAC and l-glutathione (L-GLUT) before treatment ±AA. C, control. D, transfected PANC1 cells were pretreated with NAC before treatment ±AA. Left panel, luciferase activity measured in cells transfected with the GLI1 promoter reporter shows that NAC abolishes the down-regulation of GLI1 promoter activity caused by AA. Right panel, measurement of the nuclear/cytoplasmic ratio of NFATc1 in cells transfected with NFATc1-GFP demonstrates that NAC prevents the AA-promoted increase in nuclear translocation of NFATc1. n ≥ 140 cells per group. *, p < 0.05 versus the control group. Bars and error bars represent means and S.E., respectively.
FIGURE 8.
FIGURE 8.
AA treatment inhibits tumor growth and metastasis. A, BALB/c mice were inoculated subcutaneously with 1 × 10⁶ LM3 murine mammary adenocarcinoma cells. Tumor volume was measured in the mice treated ±AA every 7 days for 21 days. Bars and error bars represent means and S.E., respectively, calculated as follows: Tumor volume = Length × Width2/2. AA group, n = 10; control group, n = 7. *, p < 0.05 versus control group. B, lung tissues sections stained with H&E were analyzed for detection of metastasis. C, apoptosis evaluation in LM3 tumor section tissues by TUNEL assay (FITC labeling). TUNEL-positive cells in the nucleus are stained in green, and total nuclei are stained with DAPI in blue (at left). Data at right show bars and error bars representing means and S.E., respectively, for quantification of the apoptosis rates (average number of TUNEL-positive cells (stained in green) per visual field). Experiments were repeated in five tumor tissue sections for each condition. Ten fields of each section were selected at random for counting in a blinded manner; n = 5. *, p < 0.05 versus control group. D and E, relative mRNA levels determined by quantitative PCR for Gli1 (D) and Bcl2, Bfl1/a1, and 4-1bb (E) in tumors from control and AA-treated animals. Bars and error bars represent means and S.E., respectively; n = 5. *, p < 0.05 versus control group.
FIGURE 9.
FIGURE 9.
Pharmacologic inhibition of GLI1 reduces tumor cell growth. A, LM3 tumor cells were treated with GANT61 at s concentration of 20 μm for 72 h. Cell viability was then measured using resazurin (left panel), and antiapoptotic gene expression was measured by q-PCR. *, p < 0.05 versus control group. B, mice implanted with LM3 cells were treated with GANT61 (50 mg/kg), and tumor size was measured as in Fig. 8. *, p < 0.01 versus control group. Bars and error bars represent means and S.E., respectively.
FIGURE 10.
FIGURE 10.
Diagram of the proposed mechanism of AA-induced antitumoral activity. This mechanism includes the NFATc1-dependent down-regulation of GLI1 and its target genes (BCL2, BFL1/A1, and 4-1BB). ROS, reactive oxygen species.

Similar articles

Cited by

References

    1. Dahm C. C., Gorst-Rasmussen A., Crowe F. L., Roswall N., Tjønneland A., Drogan D., Boeing H., Teucher B., Kaaks R., Adarakis G., Zylis D., Trichopoulou A., Fedirko V., Chajes V., Jenab M., Palli D., Pala V., Tumino R., Ricceri F., van Kranen H., Bueno-de-Mesquita H. B., Quirós J. R., Sánchez M. J., Luján-Barroso L., Larrañaga N., Chirlaque M. D., Ardanaz E., Johansson M., Stattin P., Khaw K. T., Wareham N., Wark P. A., Norat T., Riboli E., Key T. J., and Overvad K. (2012) Fatty acid patterns and risk of prostate cancer in a case-control study nested within the European Prospective Investigation into Cancer and Nutrition. Am. J. Clin. Nutr. 96, 1354–1361 - PubMed
    1. Eynard A. R., and Navarro A. (2013) Crosstalk among dietary polyunsaturated fatty acids, urolithiasis, chronic inflammation, and urinary tract tumor risk. Nutrition 29, 930–938 - PubMed
    1. Tapiero H., Ba G. N., Couvreur P., and Tew K. D. (2002) Polyunsaturated fatty acids (PUFA) and eicosanoids in human health and pathologies. Biomed. Pharmacother. 56, 215–222 - PubMed
    1. Azrad M., Turgeon C., and Demark-Wahnefried W. (2013) Current evidence linking polyunsaturated fatty acids with cancer risk and progression. Front. Oncol. 3, 224. - PMC - PubMed
    1. de Lorgeril M., and Salen P. (2012) New insights into the health effects of dietary saturated and ω-6 and ω-3 polyunsaturated fatty acids. BMC Med. 10, 50. - PMC - PubMed

Publication types

MeSH terms