

The C-terminal α-helices of mammalian Hsc70 play a critical role in the stabilization of α-synuclein binding and inhibition of aggregation
- PMID: 26601760
- PMCID: PMC4876635
- DOI: 10.1016/j.ijbiomac.2015.10.089
The C-terminal α-helices of mammalian Hsc70 play a critical role in the stabilization of α-synuclein binding and inhibition of aggregation
Abstract
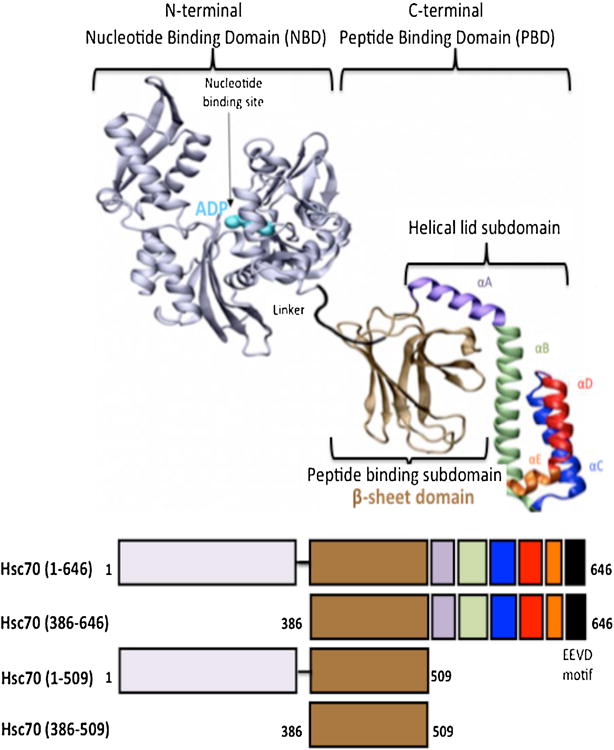
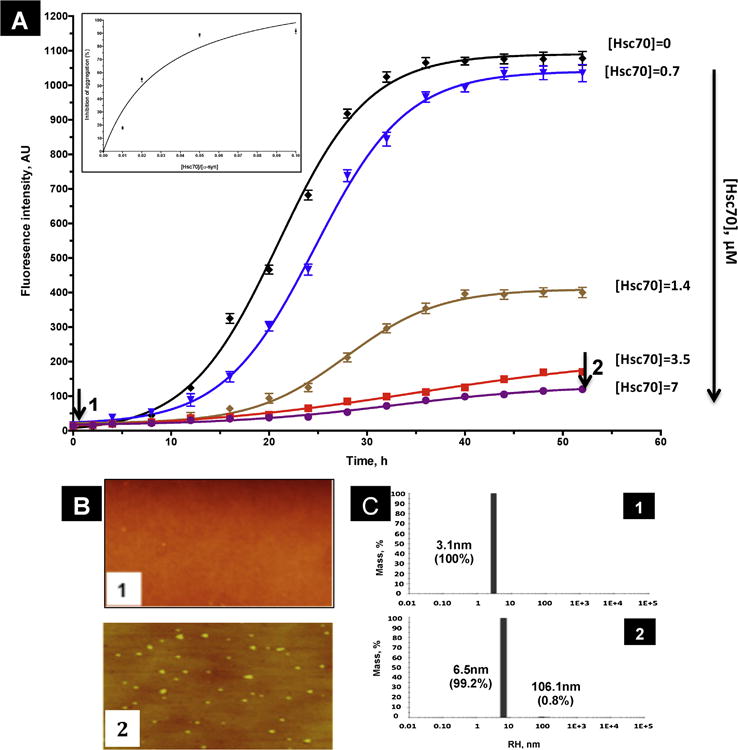
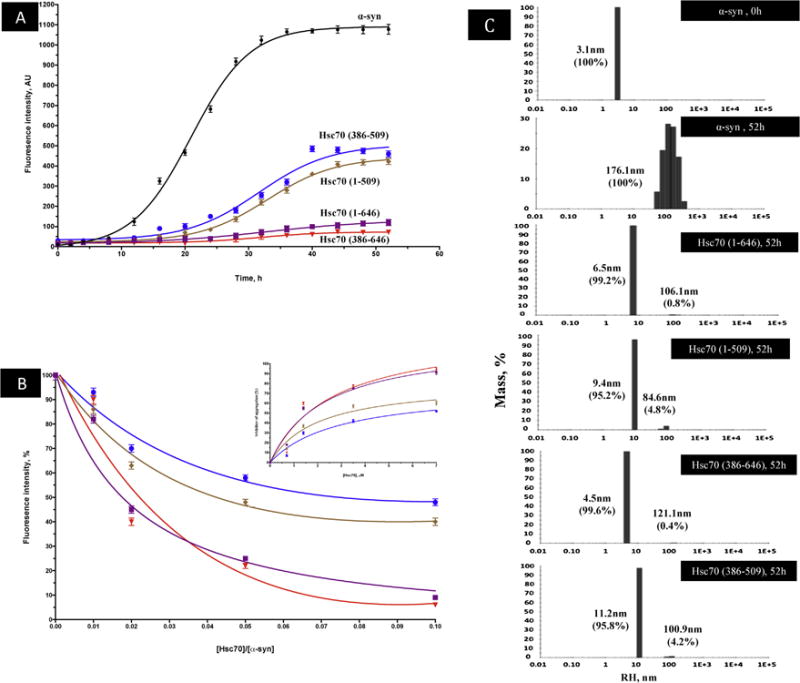
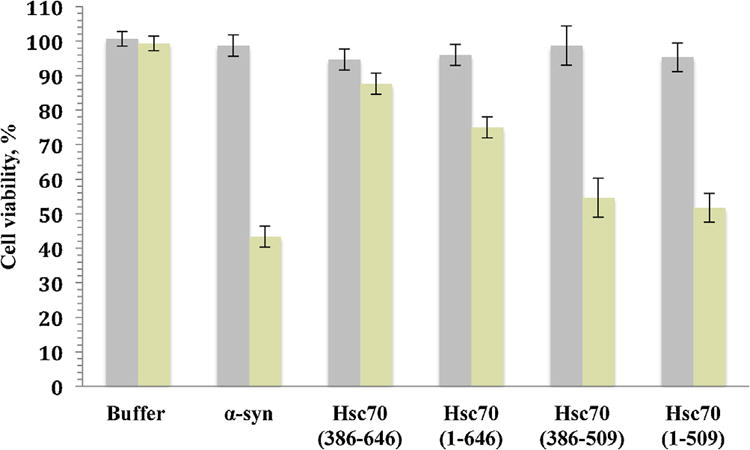
Protein misfolding, followed by aggregation and amyloid formation is an underlying pathological hallmark in a number of prevalent diseases, including Parkinson's (PD), Alzheimer's (AD) and Type 2 diabetes (T2D). In the case of PD, the aggregation of α-synuclein protein (α-syn) has been shown to be highly cytotoxic and to play a key role in the death of dopaminergic cells. Thus, inhibition of the aggregation process may be considered as an attractive avenue for therapeutic intervention. In this respect, molecular chaperones, known to promote proper folding of proteins, are able to inhibit protein aggregation thus preventing amyloid formation. In this work, the effect of the constitutively expressed chaperone Hsc70 and its various domains on α-syn aggregation have been investigated using different approaches. The results show that the C-terminal domain alone (residues 386-646) is as efficient in inhibiting α-syn aggregation as the entire Hsc70 protein, by increasing the lag phase for α-syn oligomeric nucleus formation, suggesting that the chaperone interacts with and stabilizes α-syn monomers and/or small aggregates. Deletion of the C-terminal helices (residues 510-646), which are known to play the role of a lid locking target peptide ligands in the peptide-binding site of the chaperone, strongly reduced the efficiency of inhibition of α-syn aggregation indicating that these helices play an essential in stabilizing the interaction between Hsc70 and α-syn. Furthermore, the effects of Hsc70 and its structural domains on aggregation appear to correlate with those on cytotoxicity, by reducing the fraction of α-syn toxic species to various degrees. Together these results suggest a mechanism in which inhibition of synuclein aggregation is the result of monomeric synuclein binding to the chaperone as any monomeric target unfolded protein or peptide binding to the chaperone.
Keywords: Aggregation; Alpha synuclein; Amyloid fibril; Hsc70 molecular chaperone.
Copyright © 2015 Elsevier B.V. All rights reserved.
Figures
Similar articles
-
Hsc70 protein interaction with soluble and fibrillar alpha-synuclein.J Biol Chem. 2011 Oct 7;286(40):34690-9. doi: 10.1074/jbc.M111.261321. Epub 2011 Aug 10. J Biol Chem. 2011. PMID: 21832061 Free PMC article.
-
Rotenone down-regulates HSPA8/hsc70 chaperone protein in vitro: A new possible toxic mechanism contributing to Parkinson's disease.Neurotoxicology. 2016 May;54:161-169. doi: 10.1016/j.neuro.2016.04.018. Epub 2016 Apr 28. Neurotoxicology. 2016. PMID: 27133439
-
Complexation of NAC-Derived Peptide Ligands with the C-Terminus of α-Synuclein Accelerates Its Aggregation.Biochemistry. 2018 Feb 6;57(5):791-804. doi: 10.1021/acs.biochem.7b01090. Epub 2018 Jan 22. Biochemistry. 2018. PMID: 29286644
-
Applying chaperones to protein-misfolding disorders: molecular chaperones against α-synuclein in Parkinson's disease.Int J Biol Macromol. 2013 Sep;60:196-205. doi: 10.1016/j.ijbiomac.2013.05.032. Epub 2013 Jun 5. Int J Biol Macromol. 2013. PMID: 23748003 Review.
-
α-Synuclein misfolding and aggregation: Implications in Parkinson's disease pathogenesis.Biochim Biophys Acta Proteins Proteom. 2019 Oct;1867(10):890-908. doi: 10.1016/j.bbapap.2019.03.001. Epub 2019 Mar 7. Biochim Biophys Acta Proteins Proteom. 2019. PMID: 30853581 Review.
Cited by
-
Folding or holding?-Hsp70 and Hsp90 chaperoning of misfolded proteins in neurodegenerative disease.J Biol Chem. 2022 May;298(5):101905. doi: 10.1016/j.jbc.2022.101905. Epub 2022 Apr 6. J Biol Chem. 2022. PMID: 35398094 Free PMC article. Review.
-
α-Synuclein: An All-Inclusive Trip Around its Structure, Influencing Factors and Applied Techniques.Front Chem. 2021 Jul 7;9:666585. doi: 10.3389/fchem.2021.666585. eCollection 2021. Front Chem. 2021. PMID: 34307295 Free PMC article. Review.
-
HspB1 and Hsc70 chaperones engage distinct tau species and have different inhibitory effects on amyloid formation.J Biol Chem. 2018 Feb 23;293(8):2687-2700. doi: 10.1074/jbc.M117.803411. Epub 2018 Jan 3. J Biol Chem. 2018. PMID: 29298892 Free PMC article.
-
Interactions between S100A9 and Alpha-Synuclein: Insight from NMR Spectroscopy.Int J Mol Sci. 2022 Jun 17;23(12):6781. doi: 10.3390/ijms23126781. Int J Mol Sci. 2022. PMID: 35743221 Free PMC article.
-
Chaperone proteins as ameliorators of α-synuclein-induced synaptic pathologies: insights into Parkinson's disease.Neural Regen Res. 2021 Jun;16(6):1198-1199. doi: 10.4103/1673-5374.300431. Neural Regen Res. 2021. PMID: 33269774 Free PMC article. No abstract available.
References
-
- Uversky VN. Neuropathology, biochemistry, and biophysics of alpha-synuclein aggregation. J Neurochem. 2007;103:17–37. - PubMed
-
- Soto C. Unfolding the role of protein misfolding in neurodegenerative diseases. Nat Rev Neurosci. 2003;4:49–60. - PubMed
-
- Hayden MR, Tyagi SC, Kerklo MM, Nicolls MR. Type 2 diabetes mellitus as a conformational disease. JOP. 2005;6:287–302. - PubMed
-
- Muchowski PJ, Wacker JL. Modulation of neurodegeneration by molecular chaperones. Nat Rev Neurosci. 2005;6:11–22. - PubMed
Publication types
MeSH terms
Substances
Grants and funding
LinkOut - more resources
Full Text Sources
Other Literature Sources
Miscellaneous
