Exogenous Lipocalin 2 Ameliorates Acute Rejection in a Mouse Model of Renal Transplantation
- PMID: 26595644
- PMCID: PMC4996417
- DOI: 10.1111/ajt.13521
Exogenous Lipocalin 2 Ameliorates Acute Rejection in a Mouse Model of Renal Transplantation
Abstract
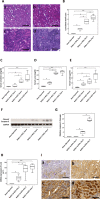
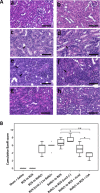
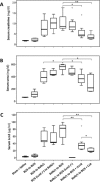
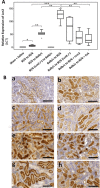
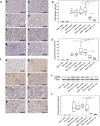
Lipocalin 2 (Lcn2) is rapidly produced by damaged nephron epithelia and is one of the most promising new markers of renal injury, delayed graft function and acute allograft rejection (AR); however, the functional importance of Lcn2 in renal transplantation is largely unknown. To understand the role of Lcn2 in renal AR, kidneys from Balb/c mice were transplanted into C57Bl/6 mice and vice versa and analyzed for morphological and physiological outcomes of AR at posttransplantation days 3, 5, and 7. The allografts showed a steady increase in intensity of interstitial infiltration, tubulitis and periarterial aggregation of lymphocytes associated with a substantial elevation in serum levels of creatinine, urea and Lcn2. Perioperative administration of recombinant Lcn2:siderophore:Fe complex (rLcn2) to recipients resulted in functional and morphological amelioration of the allograft at day 7 almost as efficiently as daily immunosuppression with cyclosporine A (CsA). No significant differences were observed in various donor-recipient combinations (C57Bl/6 wild-type and Lcn2(-/-) , Balb/c donors and recipients). Histochemical analyses of the allografts showed reduced cell death in recipients treated with rLcn2 or CsA. These results demonstrate that Lcn2 plays an important role in reducing the extent of kidney AR and indicate the therapeutic potential of Lcn2 in transplantation.
Keywords: animal models: murine, rejection: acute; basic (laboratory) research; kidney transplantation; nephrology; science.
© Copyright 2015 The American Society of Transplantation and the American Society of Transplant Surgeons.
Figures

Similar articles
-
Cytokines regulate the pattern of rejection and susceptibility to cyclosporine therapy in different mouse recipient strains after cardiac allografting.J Immunol. 2003 Oct 1;171(7):3823-36. doi: 10.4049/jimmunol.171.7.3823. J Immunol. 2003. PMID: 14500684
-
Enhanced immunosuppression improves early allograft function in a porcine kidney transplant model of donation after circulatory death.Am J Transplant. 2019 Mar;19(3):713-723. doi: 10.1111/ajt.15098. Epub 2018 Sep 26. Am J Transplant. 2019. PMID: 30152136
-
Lipocalin-2 mediates the rejection of neural transplants.FASEB J. 2021 Feb;35(2):e21317. doi: 10.1096/fj.202001018R. FASEB J. 2021. PMID: 33421207
-
The impact of age on rejection in kidney transplantation.Drugs Aging. 2005;22(5):433-49. doi: 10.2165/00002512-200522050-00007. Drugs Aging. 2005. PMID: 15903355 Review.
-
Should we use kidneys from donors with acute kidney injury for renal transplantation?Nephrology (Carlton). 2020 Feb;25(2):105-115. doi: 10.1111/nep.13679. Epub 2019 Dec 9. Nephrology (Carlton). 2020. PMID: 31707757 Review.
Cited by
-
An exome-wide study of renal operational tolerance.Front Med (Lausanne). 2023 May 17;9:976248. doi: 10.3389/fmed.2022.976248. eCollection 2022. Front Med (Lausanne). 2023. PMID: 37265662 Free PMC article.
-
Increased Endocytosis of Cadmium-Metallothionein through the 24p3 Receptor in an In Vivo Model with Reduced Proximal Tubular Activity.Int J Mol Sci. 2021 Jul 6;22(14):7262. doi: 10.3390/ijms22147262. Int J Mol Sci. 2021. PMID: 34298880 Free PMC article.
-
Aldehyde dehydrogenase 1 a1 regulates energy metabolism in adipocytes from different species.Xenotransplantation. 2017 Sep;24(5):10.1111/xen.12318. doi: 10.1111/xen.12318. Epub 2017 Jul 17. Xenotransplantation. 2017. PMID: 28718514 Free PMC article.
-
Natural Killer Cells Promote Kidney Graft Rejection Independently of Cyclosporine A Therapy.Front Immunol. 2019 Sep 24;10:2279. doi: 10.3389/fimmu.2019.02279. eCollection 2019. Front Immunol. 2019. PMID: 31616441 Free PMC article.
-
Up-regulation of LCN2 in the anterior cingulate cortex contributes to neural injury-induced chronic pain.Front Cell Neurosci. 2023 Jun 8;17:1140769. doi: 10.3389/fncel.2023.1140769. eCollection 2023. Front Cell Neurosci. 2023. PMID: 37362002 Free PMC article.
References
-
- Boros P, Bromberg JS. New cellular and molecular immune pathways in ischemia/reperfusion injury. Am J Transplant 2006; 6: 652–658. - PubMed
-
- Pratschke J, Weiss S, Neuhaus P, Pascher A. Review of nonimmunological causes for deteriorated graft function and graft loss after transplantation. Transpl Int 2008; 21: 512–522. - PubMed
-
- Meier‐Kriesche HU, Schold JD, Kaplan B. Long‐term renal allograft survival: Have we made significant progress or is it time to rethink our analytic and therapeutic strategies? Am J Transplant 2004; 4: 1289–1295. - PubMed
Publication types
MeSH terms
Substances
Grants and funding
LinkOut - more resources
Full Text Sources
Other Literature Sources
Medical
Molecular Biology Databases
Research Materials
Miscellaneous

