. 2012;9(9):724-738.
doi: 10.1139/v2012-051. Epub 2012 Aug 22.

Detailed mechanistic investigation into the S-nitrosation of cysteamine

Affiliations

Detailed mechanistic investigation into the S-nitrosation of cysteamine

Moshood K Morakinyo et al. Can J Chem. 2012.

Abstract

The nitrosation of cysteamine (H2NCH2CH2SH) to produce cysteamine-S-nitrosothiol (CANO) was studied in slightly acidic medium by using nitrous acid prepared in situ. The stoichiometry of the reaction was H2NCH2CH2SH + HNO2 → H2NCH2CH2SNO + H2O. On prolonged standing, the nitrosothiol decomposed quantitatively to yield the disulfide, cystamine: 2H2NCH2CH2SNO → H2NCH2CH2S-SCH2CH2NH2 + 2NO. NO2 and N2O3 are not the primary nitrosating agents, since their precursor (NO) was not detected during the nitrosation process. The reaction is first order in nitrous acid, thus implicating it as the major nitrosating agent in mildly acidic pH conditions. Acid catalyzes nitrosation after nitrous acid has saturated, implicating the protonated nitrous acid species, the nitrosonium cation (NO+) as a contributing nitrosating species in highly acidic environments. The acid catalysis at constant nitrous acid concentrations suggests that the nitrosonium cation nitrosates at a much higher rate than nitrous acid. Bimolecular rate constants for the nitrosation of cysteamine by nitrous acid and by the nitrosonium cation were deduced to be 17.9 ± 1.5 (mol/L)-1 s-1 and 6.7 × 10⁴ (mol/L)-1 s-1, respectively. Both Cu(I) and Cu(II) ions were effective catalysts for the formation and decomposition of the cysteamine nitrosothiol. Cu(II) ions could catalyze the nitrosation of cysteamine in neutral conditions, whereas Cu(I) could only catalyze in acidic conditions. Transnitrosation kinetics of CANO with glutathione showed the formation of cystamine and the mixed disulfide with no formation of oxidized glutathione (GSSG). The nitrosation reaction was satisfactorily simulated by a simple reaction scheme involving eight reactions.

Keywords: cysteamine; kinetics; nitric oxide; nitrosation; thiols.


Figures

Fig. 1
Fig. 1
UV–vis spectral scan of reactants 0.01 mol/L cysteamine hydrochloride (CA, a), 0.001 mol/L NaNO2 (b), 0.001 mol/L HNO2 (c), and product 0.001 mol/L S-nitrosocysteamine (CANO, d).
Fig. 2
Fig. 2
Mass spectrometry analysis of the product of nitrosation of cysteamine hydrochloride (CA) showing (A) formation of S-nitrosocysteamine (CANO), m/z = 107.9999; (B) product of decomposition of CANO after 24 h. Cystamine, a disulfide of CA was produced with a strong peak, m/z = 153.0608.
Fig. 3
Fig. 3
Electron paramagnetic resonance (EPR) spectra of the NO radical generated during the decomposition of S-nitrosocysteamine (CANO) using 0.5 mol/L nitroethane (NE) in 1.0 mol/L NaOH solution as the spin trap. (A) 0.5 mol/L NE, (B) 0.01 mol/L NO2, (C) 0.04 mol/L cysteamine hydrochloride (CA), (D) [CANO] = 0.01 mol/L, (E) [CANO] = 0.02 mol/L, (F) [CANO] = 0.03 mol/L, and (G) [CANO] = 0.04 mol/L.
Fig. 4
Fig. 4
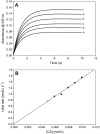
(A) Absorbance traces showing the effect of varying cysteamine hydrochloride (CA) concentrations. The reaction displays first-order kinetics in CA. [NO2]0 = 0.10 mol/L; [H+]0 = 0.10 mol/L; and (a) [CA]0 = 0.005 mol/L; (b) [CA]0 = 0.006 mol/L; (c) [CA]0 = 0.007 mol/L; (d) [CA]0 = 0.008 mol/L; (e) [CA]0 = 0.009 mol/L; and (f) [CA]0 = 0.010 mol/L. (B) Initial rate plot of the data in Fig. 4A. The plot shows the strong first-order dependence of the rate of formation of S-nitrosocysteamine (CANO) on CA, with an intercept kinetically indistinguishable from zero.
Fig. 5
Fig. 5
Initial rate plot from the data derived from varying nitrite ion concentrations in excess acid over nitrite. [CA]0 = 0.10 mol/L; [H+]0 = 0.10 mol/L; and [NO2]0 was varied from 0.005 to 0.010 mol/L. The plot shows strong first-order dependence on initial rate of formation of S-nitrosocysteamine (CANO) on nitrite. CA, cysteamine hydrochloride.
Fig. 6
Fig. 6
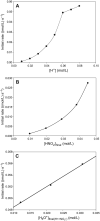
(A) Plot of the raw kinetics data for the effect of added acid on the rate of nitrosation.[CA]0 = 0.05 mol/L; [NO2]0 = 0.05 mol/L; and [H+]0 was varied between 0.01 and 0.08 mol/L. For the first four data points, [NO2]0 > [H+]0. The linear potion of the plot represents excess proton concentrations over nitrite. Acid concentrations plotted here are those experimentally added and not calculated. (B) Plot of initial rate versus nitrous acid concentrations of the experimental data in Fig. 6A and calculated in Table 1. This plot involves the region at which initial nitrite concentrations exceed acid concentrations. (C) Plot showing the linear dependence of the rate of formation of S-nitrosocysteamine (CANO) on [H3O+] in high acid concentrations, where initial acid concentrations exceed nitrite concentrations. Nitrous acid concentrations are nearly constant in this range (see Table 1).
Fig. 7
Fig. 7
(A) Absorbance traces showing the effect of varying Cu2+ concentrations on the rate of formation of CANO. There is a progressive increase in the rate of S-nitrosocysteamine (CANO) formation with an increase in Cu2+ concentration. [CA]0 = [NO2]0 = [H ]0 = 0.05 mol/L; and (a) [Cu2+]0 = 0.00 mol/L, (b) [Cu2+]0 = 5 μmol/L, (c) [Cu2+]0 = 15 μmol/L, (d) [Cu2+]0 = 100 μmol/L, (e) [Cu2+]0 = 1 mmol/L, and (f) [Cu2+]0 = 2.5 mmol/L. CA, cysteamine hydrochloride. (B) Absorbance traces showing the formation of CANO via a reaction of CA, nitrite, and copper(II) without acid. The amount of CANO formed increases with an increase in Cu2+ concentration. No formation of CANO was observed with Cu+. The result shows the catalytic effect of Cu2+ on the rate of formation of S-nitrosothiol (RSNO). [CA]0 = [NO2 ]0 = [H ]0 = 0.05 mol/L; and (a) [Cu2+] = 0.0025 mol/L, (b) [Cu2+] = 0.0030 mol/L, (c) [Cu2+] = 0.0035 mol/L, (d) [Cu2+] = 0.0040 mol/L, (e) [Cu2+] = 0.0045 mol/L, and (f) [Cu2+] = 0.0050 mol/L. (C) Effect of Cu2+ on the stability of CANO in a pH 7.4 phosphate buffer. This reaction involves the reduction of Cu2+ to Cu+, which causes the decomposition of CANO. [CANO]0 = 0.028 mol/L; (a) [Cu2+]0 = 0.00 mol/L (pure CANO), (b) [Cu2+]0 = 0.00 mol/L (pure CANO in 0.00001 mol/L EDTA), (c) [Cu2+]0 = 5 μmol/L, (d) [Cu2+]0 = 10 μmol/L, (e) [Cu2+]0 = 20 μmol/L, and (f) [Cu2+]0 = 30 μmol/L. (D) Electron paramagnetic resonance (EPR) spectra of the NO radical showing the catalytic effect of Cu2+ on the rate of decomposition of CANO. The intensity of the spectra increases with an increase in Cu2+ concentration. [CANO]0 = 0.01 mol/L; (a) [Cu2+]0 = 0.00, (b) [Cu2+]0 = 1.0 × 10⁻⁴ mol/L, and (c) [Cu2+]0 = 2.0 × 10⁻⁴ mol/L.
Fig. 8
Fig. 8
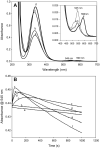
(A) Superimposed spectra of four well-known nitrosothiols (a) CysNO, (b) S-nitrosocysteamine (CANO), (c) S-nitrosoglutathione (GSNO), and (d) nitrosothiol of penicillamine (SNAP). Three of them nearly have the same ε at 545 nm. The observed separation in the absorbances of these three at 545 nm is due to staggering of the time lag before acquiring the spectrum. (B) The effect of glutathione (GSH) on the stability of CANO in a pH 7.4 phosphate buffer. All experimental traces have [CA]0 = 0.03 mol/L, [NO2]0 = 0.03 mol/L, and [H+]0 = 0.05 mol/L. (a) [GSH] = 0, (b) [GSH] = 0, (c) [GSH] = 0.01 mol/L, (d) [GSH] = 0.02 mol/L, (e) [GSH] = 0.03 mol/L, and (f) [GSH] = 0.05 mol/L. Traces a and b are controls. Trace a has no EDTA. Trace b is the same as trace a with 10 μmol/L of EDTA. There is no significant difference between traces a and b, indicating that the water used for preparing reagent solutions did not contain enough trace metal ions to affect the kinetics. Ten microlitres of EDTA was added to
Fig. 9
Fig. 9
A GC–MS spectrum of a 3:5 ratio of S-nitrosocysteamine (CANO) to glutathione (GSH); trace f in Fig. 8B. Final products were predominantly the mixed disulfide and cysteamine with no evidence of oxidized glutathione (GSSG). CA, cysteamine hydrochloride.
Fig. 10
Fig. 10
Evaluating the effect of oxygen on the rate of nitrosation of cysteamine. The solutions purged with argon (trace a) give a very slightly lower rate of nitrosation, indicating a small and insignifant contribution of nitrosation by N2O3. [CA]0 = 0.05 mol/L; [H+]0 = 0.08 mol/L; and [NO2]0 = 0.07 mol/L. CA, cysteamine hydrochloride.
Fig. 11
Fig. 11
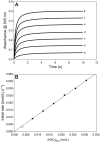
(A) Evaluation of unambigous nitrous acid dependence by employing [H+]0 = [NO2]0 and varying both at the same equimolar concentrations. [CA]0 fixed at 0.25 mol/L. (a) [H+]0 = [NO2]0 = 0.005 mol/L, (b) [H+]0 = [NO2]0 = 0.010 mol/L, (c) [H+]0 = [NO2]0 = 0.015 mol/L, (d) [H+]0 = [NO2]0 = 0.020 mol/L, (e) [H+]0 = [NO2]0 = 0.025 mol/L, (f) [H+]0 = [NO2]0 = 0.030 mol/L, and (g) [H+]0 = [NO2]0 = 0.035 mol/L. (B) Plot of initial rate of nitrosation versus initial nitrous acid concentrations as calculated in Table 2 and derived from the data in Fig. 11A. This plot is linear, as opposed to Fig. 6C.
Fig. 12
Fig. 12
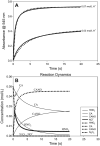
(A) Simulation of the short set of reactions shown in Table 3. Solid lines are experimental data and the symbols indicate simulations. The mechanism is dominated by the value of the bimolecular rate constant for the nitrosation of cysteamine hydrochloride (CA) by HNO2 (k1). [CA]0 = [NO2]0 = 0.05 mol/L. (B) Results from the modeling that delivered simulations of the two traces shown in Fig. 12A. These simulations show the concentration variations of those species that could not be experimentally monitored. Neither N2O3 nor NO+ rise to any significant concentration levels.

Similar articles

Cited by

References

    1. Thomas DD, Ridnour LA, Isenberg JS, Flores-Santana W, Switzer CH, Donzelli S, Hussain P, Vecoli C, Paolocci N, Ambs S, Colton CA, Harris CC, Roberts DD, Wink DA. Free Radic. Biol. Med. 2008;45(1):18. doi:10.1016/j.freeradbiomed.2008.03.020. - PMC - PubMed
    1. Möller MN, Li Q, Vitturi DA, Robinson JM, Lancaster JR, Jr, Denicola A. Chem. Res. Toxicol. 2007;20(4):709. doi:10.1021/tx700010h. - PubMed
    1. Li H, Samouilov A, Liu X, Zweier JL. J. Biol. Chem. 2001;276(27):24482. doi:10.1074/jbc.M011648200. - PubMed
    1. Zweier JL, Li H, Samouilov A, Liu X. Nitric Oxide. 2010;22(2):83. doi:10.1016/j.niox.2009.12.004. - PMC - PubMed
    1. Godber BL, Doel JJ, Sapkota GP, Blake DR, Stevens CR, Eisenthal R, Harrison R. J. Biol. Chem. 2000;275(11):7757. doi:10.1074/jbc.275.11.7757. - PubMed

LinkOut - more resources