. 2015 Nov 23:6:8893.
doi: 10.1038/ncomms9893.

Control of developmentally primed erythroid genes by combinatorial co-repressor actions

Affiliations

Control of developmentally primed erythroid genes by combinatorial co-repressor actions

Ralph Stadhouders et al. Nat Commun. .

Abstract

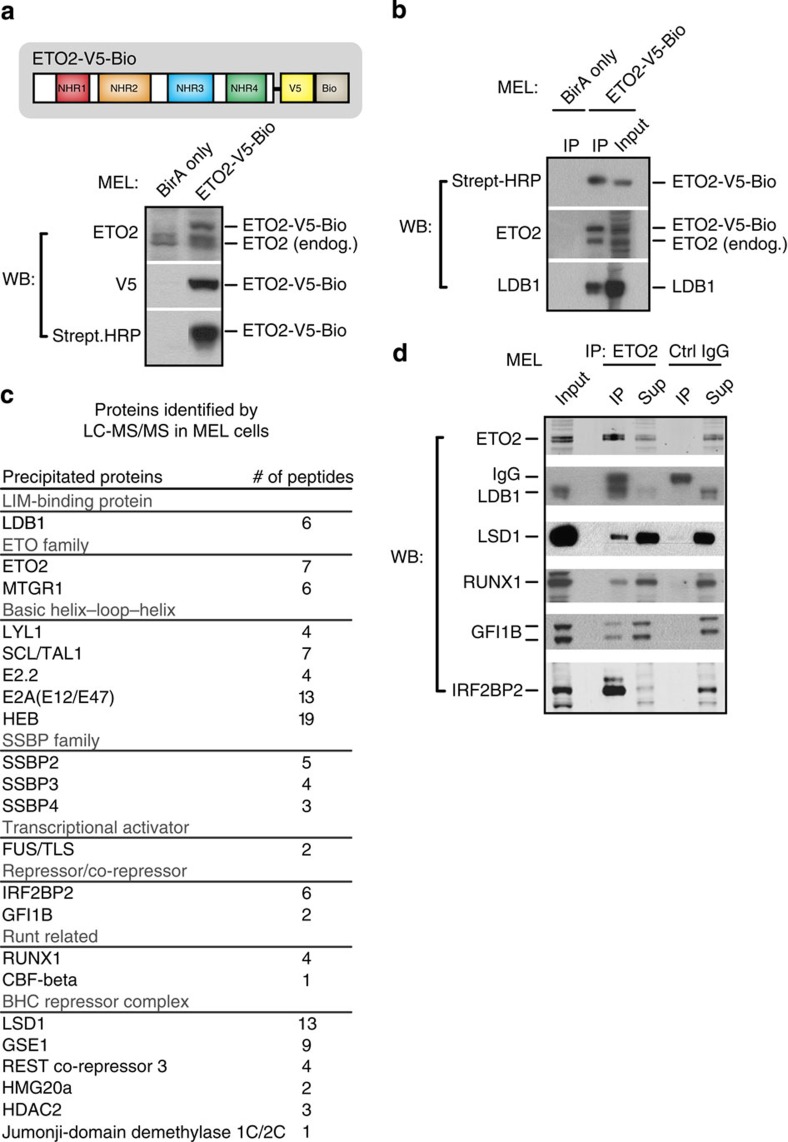
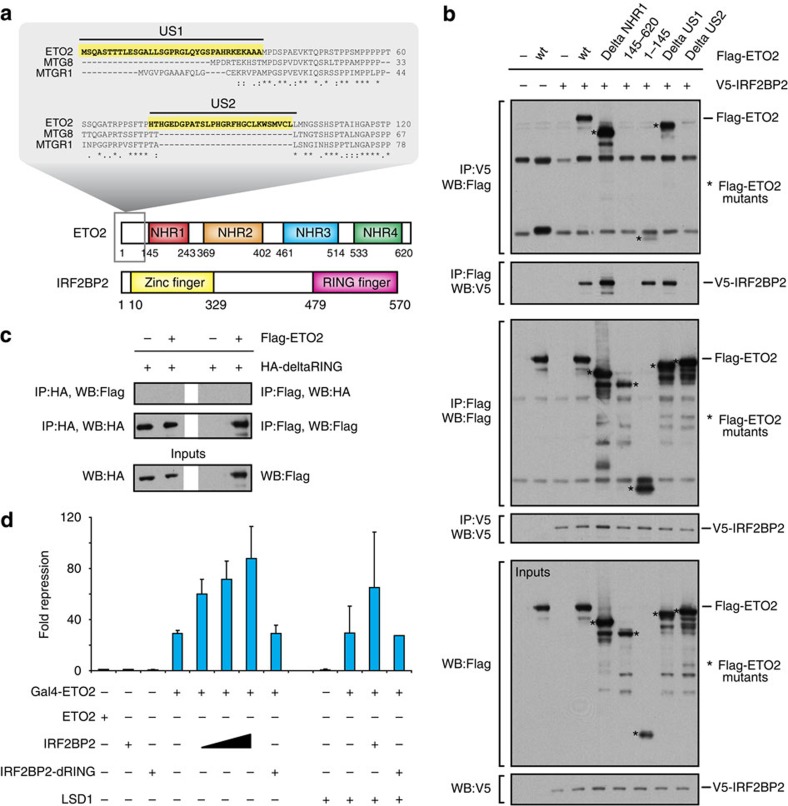
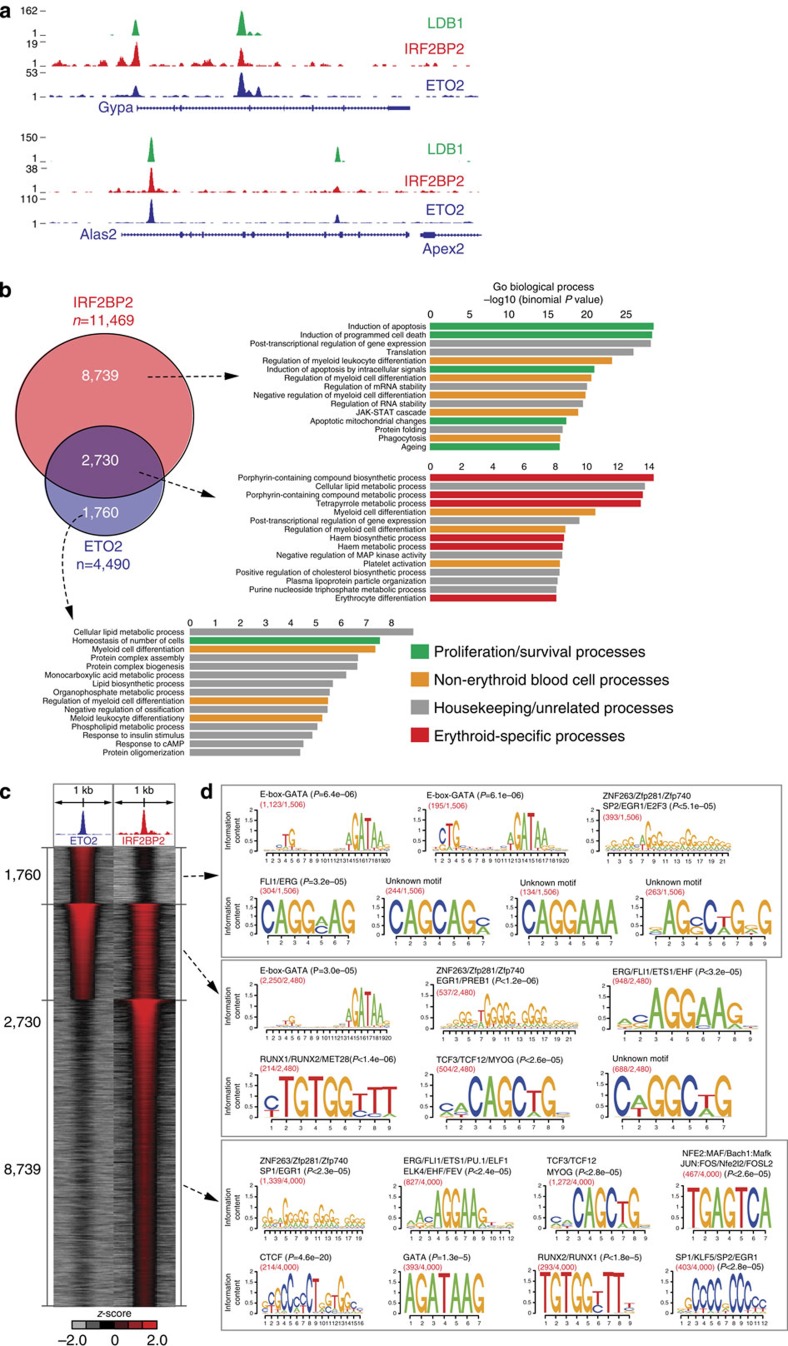
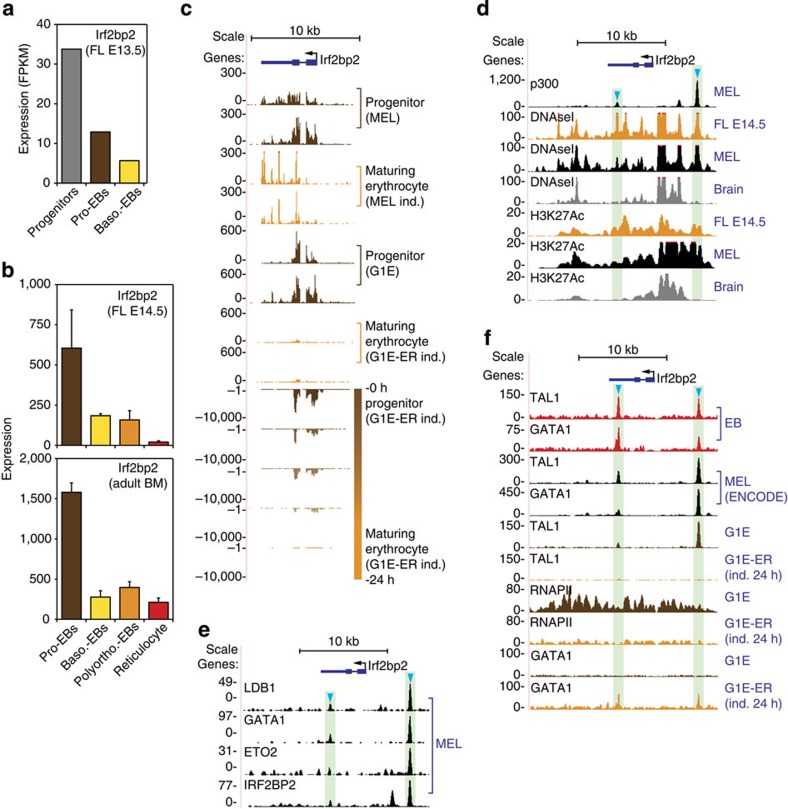
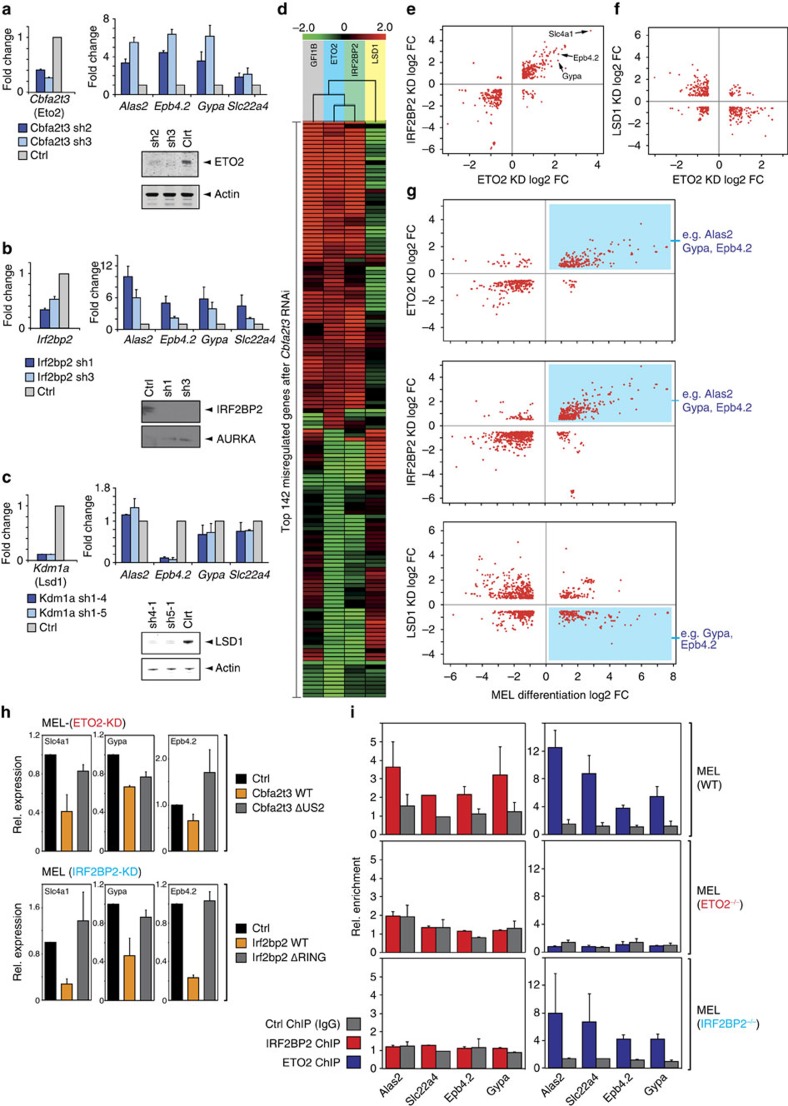
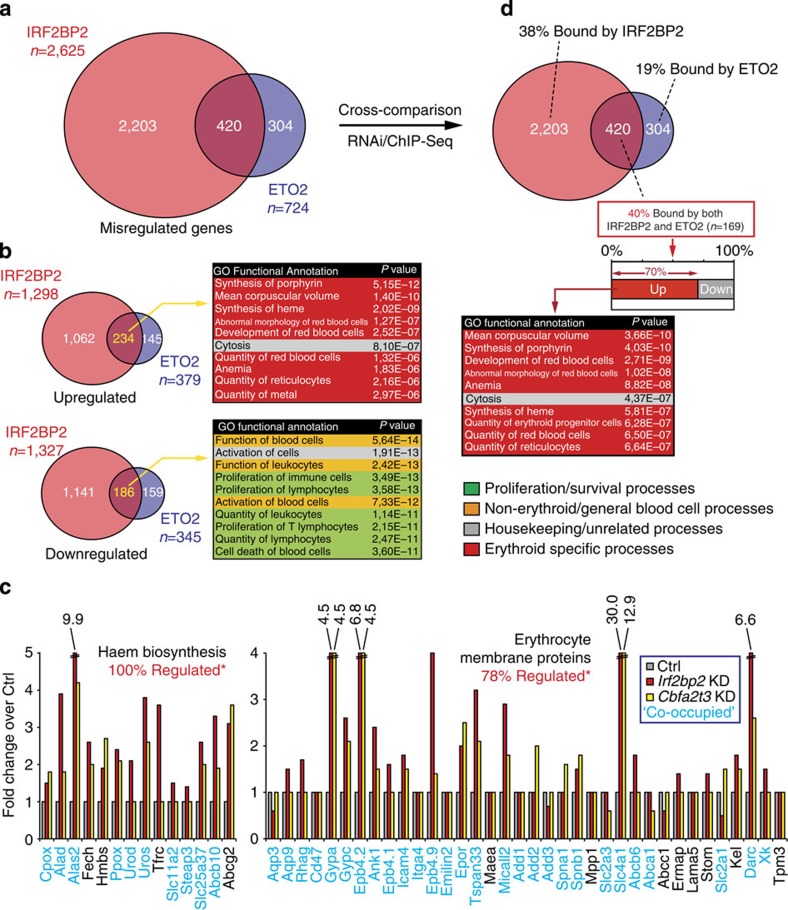
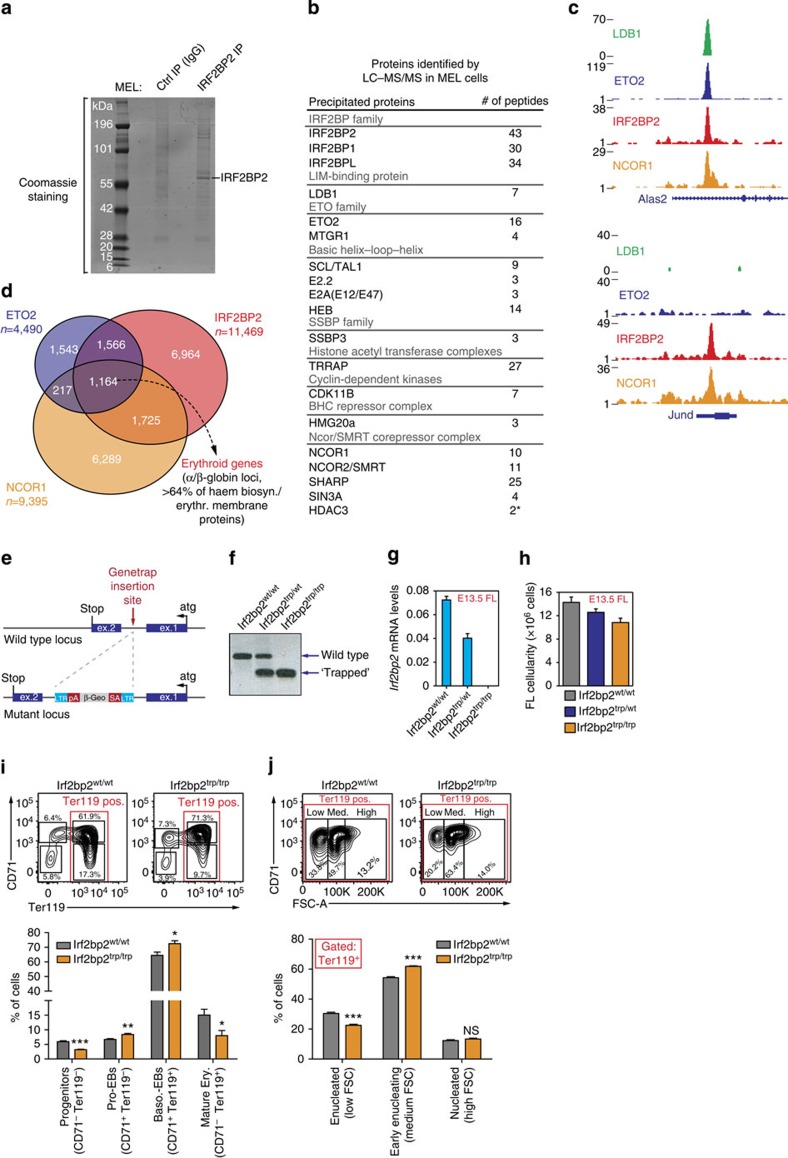
How transcription factors (TFs) cooperate within large protein complexes to allow rapid modulation of gene expression during development is still largely unknown. Here we show that the key haematopoietic LIM-domain-binding protein-1 (LDB1) TF complex contains several activator and repressor components that together maintain an erythroid-specific gene expression programme primed for rapid activation until differentiation is induced. A combination of proteomics, functional genomics and in vivo studies presented here identifies known and novel co-repressors, most notably the ETO2 and IRF2BP2 proteins, involved in maintaining this primed state. The ETO2-IRF2BP2 axis, interacting with the NCOR1/SMRT co-repressor complex, suppresses the expression of the vast majority of archetypical erythroid genes and pathways until its decommissioning at the onset of terminal erythroid differentiation. Our experiments demonstrate that multimeric regulatory complexes feature a dynamic interplay between activating and repressing components that determines lineage-specific gene expression and cellular differentiation.


Figures

Figure 1
Figure 1. Identification of ETO2-binding partners in erythroid progenitor cells.
(a) Schematic of the ETO2 protein, its 4 Nervy homology regions (NHR1-4) and the C-terminal V5-Bio tag (top). Fusion protein expression and proper tag function in MEL cells were validated by WB analysis. MEL cells expressing only the BirA enzyme were used as a control. (b) Efficient streptavidin IP of ETO2-V5-Bio in MEL cells. Interaction of ETO2-V5-Bio with LDB1 (a known binding partner) was used for validation. (c) ETO2-V5-Bio-interacting proteins identified by LC–MS/MS in MEL cells. Only proteins pulled down in two independent experiments and with low background scores are shown. (d) Co-IP validations of selected ETO2-V5-Bio-interacting proteins in MEL cells using an endogenous ETO2 antibody. Species-matched IgG was used to control for aspecific binding. Full-size images of all western blots shown can be found in Supplementary Fig. 10. Strept-HRP, streptavidin-HRP; Sup, supernatant; endog., endogenous; WB, western blot; IP, immunoprecipitation.
Figure 2
Figure 2. ETO2 and IRF2BP2 interact via their US2 and RING domains, respectively, to cooperatively repress reporter gene activity.
(a) Schematic of the ETO2 and IRF2BP2 proteins and known functional domains. First and last amino-acid positions of known functional domains are indicated by numbers. Highlighted are two unique N-terminal amino-acid sequences (US1 and US2) only present in ETO2. (b) ETO2 interaction domain mapping using a collection of Flag-tagged deletion mutants that were overexpressed in HEK 293T cells together with V5-IRF2BP2. Bands representing the ETO2 mutant proteins are marked by an asterisk. (c) An HA-tagged IRF2BP2 lacking the C-terminal RING-finger domain (HA-deltaRING) was used in co-IP experiments with Flag-ETO2. (d) Luciferase reporter assay to test repression of a Gal4-responsive promoter (coupled to a firefly luciferase gene) by ETO2 and its interacting partners IRF2BP2 and LSD1. Fusion to a Gal4 DNA-binding domain (Gal4–ETO2) was used to target ETO2 to the promoter. Different combinations of Gal4-ETO2 and IRF2BP2, deltaRING and LSD1 were co-transfected and firefly luciferase expression was measured after 48 h. Co-transfection with equal amounts of a Renilla luciferase expression plasmid was used for normalization. Bars represent average values of at least three independent transfection experiments; error bars denote s.d. Full-size images of all WBs shown can be found in Supplementary Fig. 11. WB, western blot; IP, immunoprecipitation.
Figure 3
Figure 3. ETO2–IRF2BP2 genomic co-occupancy is associated with genes involved in key erythroid processes.
(a) Selected examples of overlapping ChIP-Seq profiles for LDB1, IRF2BP2 and ETO2 in MEL cells on key erythroid gene loci. (b) Venn diagram showing the genome-wide overlap between ETO2- and IRF2BP2-binding sites in MEL cells. GREAT analysis (see Methods for more details) was performed for each group of binding sites (ETO2 only, co-occupied and IRF2BP2 only) to identify their putative target genes and possible significantly associated Gene Ontology (GO) terms. The top 15 GO terms are shown for each group of binding sites, and individual GO terms were categorized into four classes (erythroid-related, non-erythroid blood-related, proliferation/survival-related and housekeeping/unrelated). (c) Heatmap visualization of ETO2 and IRF2BP2 ChIP-Seq data, depicting all significant binding events centred on the peak region within a 1-kb window around the peak (binding sites were ranked on intensity). (d) A motif analysis (see Methods for more details) on the three groups of binding sites (ETO2 only, co-occupied and IRF2BP2 only) was performed to identify possible over-represented transcription factor-binding motifs within the peak sequences. Red numbers denote (number of motifs)/(total number of binding sites).
Figure 4
Figure 4. Irf2bp2 gene expression and transcriptional regulation during erythroid development.
(a) Irf2bp2 expression levels at different stages of erythroid development (‘Progenitors', CD71/Ter119; ‘Pro-EBs', CD71+/Ter119; ‘Baso-EBs, CD71+/Ter119+) as determined by RNA-Seq analysis of sorted E13.5 fetal liver (FL) cells (n=1). (b) Irf2bp2 gene expression values at different stages of erythroid development in E14.5 FL and adult bone marrow (BM). Data were obtained from the online ErythronDB database (n=5, error bars denote s.d.). (cf) Genome-wide data sets centred on the Irf2bp2 locus from MEL, G1E(-ER), E14.5 FL, erythroblast (EB) and whole-brain cells. (c) RNA-Seq data from (differentiating) erythroid progenitors. (d) ChIP-Seq (p300 and H3K27Ac, both associated with enhancer activity) and DNase I-Seq (denotes regions of open chromatin) tracks; note the presence of two erythroid-specific putative enhancer elements (blue arrowheads). (e) LDB1 complex (including IRF2BP2) occupancy of these putative enhancer elements in MEL cells. (f) GATA1, TAL1 and RNAPII binding to the Irf2bp2 locus in erythroid cells. Note the loss of TAL1 binding to the putative enhancer elements in differentiating G1E-ER cells, accompanied by a loss of RNAPII enrichments. Data shown in c,d and f were obtained from the ENCODE consortium (see Methods for details). Pro-EBs, pro-erythroblasts; Baso-EBs, basophilic erythroblasts; Polyortho-EBs, polyorthochromatic erythroblasts; RNAPII, RNA polymerase II.
Figure 5
Figure 5. Genome-wide analysis of gene expression changes shows that ETO2 and IRF2BP2 repress the late erythroid transcriptome.
Lentiviral delivery of shRNAs against Cbfa2t3 (a), Irf2bp2 (b) and Kdm1a (c) mRNA to deplete MEL cells of the ETO2, LSD1 and IRF2BP2 proteins, respectively. A non-targeting shRNA (Ctrl) was used as a control. After 72 h, mRNA levels were measured by qPCR (normalized versus Rnh1 levels) or protein levels by western blot (actin and AURKA were used as loading controls). Expression levels of four archetypical late erythroid genes (Alas2, Epb4.2, Gypa and Slc22a4) were quantified by qPCR. (d) Unsupervised clustering of the top 142 misregulated genes after Cbfa2t3 (ETO2) KD and the expression changes of the same set of genes induced after GFI1B, IRF2BP2 and LSD1 depletion. Gene expression changes are shown as log2 fold change (FC). (eg) Correlations between gene expression changes (log2 FC) after ETO2/IRF2BP2/LSD1 KD (72 h post transduction) or MEL cell differentiation (96 h). Red dots represent individual genes (see Methods for more information on thresholds used). Positions of archetypical late erythroid genes (for example, Alas2, Epb4.2 and Gypa) within the graphs are indicated. (h) MEL cells transduced with Cbfa2t3-sh3 (top) and Irf2bp2-sh1 (panel) lentiviruses were transfected with empty pcDNA3.1 vector (Ctrl), wild-type cDNA or with an interaction-deficient mutant Cbfa2t3 or Irf2bp2 cDNA (also see Fig. 2). Gene expression of three late erythroid genes was measured 48 h after transfection by qPCR (normalized versus Rnh1 levels). (i) ChIP-qPCR experiments for ETO2 and IRF2BP2 in parental wild-type (WT) MEL cells, ETO2−/− and BP2−/− MEL cell lines generated using CRISPR/Cas9 technology. Protein binding was examined on the regulatory regions of Alas2, Slc22a4, Epb4.2 and Gypa. Species-matched IgG was used as a negative control. All bars represent averages of at least two independent experiments; error bars denote s.d. Full-size images of all western blots shown can be found in Supplementary Fig. 11.
Figure 6
Figure 6. The ETO2–IRF2BP2 axis directly controls the expression of key haem biosynthesis and erythrocyte membrane proteins.
(a) Venn diagram of differentially expressed genes (log2 FC >0.5/−0.5, P<0.05) after ETO2 or IRF2BP2 depletion in MEL cells. (b) Venn diagrams of upregulated genes (top, log2 FC >0.5, P<0.05) and downregulated genes (bottom, log2 FC >−0.5, P<0.05) after ETO2 or IRF2BP2 depletion. Genes found commonly up- or downregulated were subjected to Gene Ontology (GO) analysis using Ingenuity Pathway Analysis (IPA); the top 10 significantly associated GO functional annotations are shown. GO terms were categorized as in Fig. 3b. (c) Fold changes in gene expression (log2 FC >0.5/−0.5, P<0.05; genes not significantly affected were given a fold change of 1) of haem biosynthesis and erythrocyte membrane protein genes upon Cbfa2t3 (encoding ETO2) and Irf2bp2 KD. Expression levels obtained from MEL cells transduced with a non-targeting shRNA (ctrl) were set to 1. Genes bound by both ETO2 and IRF2BP2 in MEL cells (Co-occupied) are shown in blue. ‘*-% Regulated' refers to the % of total genes in the group misregulated upon Irf2bp2 and/or Cbfa2t3 KD. (d) Cross-combinatorial analysis of ETO2/IRF2BP2 ChIP-Seq data and differentially expressed genes after Cbfa2t3/Irf2bp2 RNAi. Overall, 38% (IRF2BP2) and 31% (ETO2) of misregulated genes are also bound by the corresponding protein. Thirty-eight percent of the genes specifically misregulated by IRF2BP2 are bound only ‘by IRF2BP2; 19% of specific ETO2 misregulated genes are bound by only ETO2; and of the commonly misregulated genes 40% (n=169) was bound by both factors. Seventy percent of these co-bound/regulated genes are repressed by ETO2/IRF2BP2 and enriched for erythroid GO terms. GREAT analysis was used for assigning target genes to ChIP-Seq peaks as described in the Methods section.
Figure 7
Figure 7. Characterization of IRF2BP2 protein partners and fetal liver erythropoiesis in IRF2BP2-deficient mice.
(a) Coomassie staining of IRF2BP2 and control IgG-immunoprecipitated proteins separated by SDS–polyacrylamide gel electrophoresis. (b) IRF2BP2-interacting proteins identified by LC–MS/MS in MEL cells. Proteins pulled down in two independent experiments and with low background scores are shown, except for HDAC3 (*—only detected in one pull down). (c) Examples of NCOR1 recruitment to IRF2BP2-binding sites. (d) Venn diagram showing the genome-wide overlap between ETO2-, IRF2BP2- and NCOR1-binding sites in MEL cells. Note the significant co-localization of all three factors on the chromatin (1,164 sites), which included the α- and β-globin loci and >64% of haem biosynthesis and erythrocyte membrane protein genes shown in Fig. 6c. (e) A genetrap vector (containing a strong splice-acceptor (SA) and a polyadenylation sequence (pA)) was retrovirally inserted in the Irf2bp2 intron to disrupt full-length mRNA production (genetrap allele is referred to as ‘Irf2bp2trp'). (f) Typical genotyping results obtained from a standard 3-primer PCR strategy. (g) Irf2bp2 mRNA levels in whole fetal livers (FL) from E13.5 mouse embryos with the indicated genotypes (n=4–6 embryos per genotype, normalized to Rnh1 levels). (h) Total FL cellularity in E13.5 embryos with the indicated genotypes (n=5–21 embryos per genotype). (i,j) Flow cytometry analysis (CD71-Ter119 double-staining) of FLs from E13.5 embryos with the indicated genotypes (n=9–11 embryos per genotype). Representative flow cytometry plots are shown on top; average values are plotted as bar graphs underneath. (i) A quadrant analysis of CD71-Ter119 staining on all live (Hoechst negative) single cells to visualize erythroid differentiation. (j) Ter119+ FL cells separated into three populations based on the FSC profile. Differences between wild-type and Irf2bp2trp/trp embryos were tested for statistical significance (Mann–Whitney U-test; *P<0.05, **P<0.01, ***P<0.001). Error bars denote s.d. NS, not significant.

Similar articles

Cited by

References

    1. Orkin S. H. & Zon L. I. Hematopoiesis: an evolving paradigm for stem cell biology. Cell 132, 631–644 (2008) . - PMC - PubMed
    1. Love P. E., Warzecha C. & Li L. Ldb1 complexes: the new master regulators of erythroid gene transcription. Trends Genet. 30, 1–9 (2014) . - PMC - PubMed
    1. Schuh A. H. et al.. ETO-2 associates with SCL in erythroid cells and megakaryocytes and provides repressor functions in erythropoiesis. Mol. Cell. Biol. 25, 10235–10250 (2005) . - PMC - PubMed
    1. Goardon N. et al.. ETO2 coordinates cellular proliferation and differentiation during erythropoiesis. EMBO J. 25, 357–366 (2006) . - PMC - PubMed
    1. Soler E. et al.. The genome-wide dynamics of the binding of Ldb1 complexes during erythroid differentiation. Genes Dev. 24, 277–289 (2010) . - PMC - PubMed

Publication types

MeSH terms