Human Immunodeficiency Virus Type 1 Monoclonal Antibodies Suppress Acute Simian-Human Immunodeficiency Virus Viremia and Limit Seeding of Cell-Associated Viral Reservoirs
- PMID: 26581981
- PMCID: PMC4719604
- DOI: 10.1128/JVI.02454-15
Human Immunodeficiency Virus Type 1 Monoclonal Antibodies Suppress Acute Simian-Human Immunodeficiency Virus Viremia and Limit Seeding of Cell-Associated Viral Reservoirs
Abstract
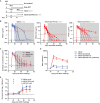
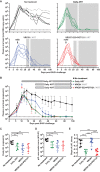
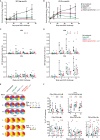
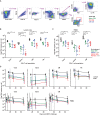
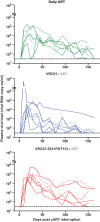
Combination antiretroviral therapy (cART) administered shortly after human immunodeficiency virus type 1 (HIV-1) infection can suppress viremia and limit seeding of the viral reservoir, but lifelong treatment is required for the majority of patients. Highly potent broadly neutralizing HIV-1 monoclonal antibodies (MAbs) can reduce plasma viremia when administered during chronic HIV-1 infection, but the therapeutic potential of these antibodies during acute infection is unknown. We tested the ability of HIV-1 envelope glycoprotein-specific broadly neutralizing MAbs to suppress acute simian-human immunodeficiency virus (SHIV) replication in rhesus macaques. Four groups of macaques were infected with SHIV-SF162P3 and received (i) the CD4-binding-site MAb VRC01; (ii) a combination of a more potent clonal relative of VRC01 (VRC07-523) and a V3 glycan-dependent MAb (PGT121); (iii) daily cART, all on day 10, just prior to expected peak plasma viremia; or (iv) no treatment. Daily cART was initiated 11 days after MAb administration and was continued for 13 weeks in all treated animals. Over a period of 11 days after a single administration, MAb treatment significantly reduced peak viremia, accelerated the decay slope, and reduced total viral replication compared to untreated controls. Proviral DNA in lymph node CD4 T cells was also diminished after treatment with the dual MAb. These data demonstrate the virological effect of potent MAbs and support future clinical trials that investigate HIV-1-neutralizing MAbs as adjunctive therapy with cART during acute HIV-1 infection.
Importance: Treatment of chronic HIV-1 infection with potent broadly neutralizing HIV-1 MAbs has been shown to significantly reduce plasma viremia. However, the antiviral effect of MAb treatment during acute HIV-1 infection is unknown. Here, we demonstrate that MAbs targeting the HIV-1 envelope glycoprotein both suppress acute SHIV plasma viremia and limit CD4 T cell-associated viral DNA. These findings provide support for clinical trials of MAbs as adjunctive therapy with antiretroviral therapy during acute HIV-1 infection.
Copyright © 2016, American Society for Microbiology. All Rights Reserved.
Figures
Similar articles
-
Virological Control by the CD4-Binding Site Antibody N6 in Simian-Human Immunodeficiency Virus-Infected Rhesus Monkeys.J Virol. 2017 Jul 27;91(16):e00498-17. doi: 10.1128/JVI.00498-17. Print 2017 Aug 15. J Virol. 2017. PMID: 28539448 Free PMC article.
-
Protective Efficacy of Broadly Neutralizing Antibodies with Incomplete Neutralization Activity against Simian-Human Immunodeficiency Virus in Rhesus Monkeys.J Virol. 2017 Sep 27;91(20):e01187-17. doi: 10.1128/JVI.01187-17. Print 2017 Oct 15. J Virol. 2017. PMID: 28768869 Free PMC article.
-
Development of Broadly Neutralizing Antibodies and Their Mapping by Monomeric gp120 in Human Immunodeficiency Virus Type 1-Infected Humans and Simian-Human Immunodeficiency Virus SHIVSF162P3N-Infected Macaques.J Virol. 2016 Mar 28;90(8):4017-4031. doi: 10.1128/JVI.02898-15. Print 2016 Apr. J Virol. 2016. PMID: 26842476 Free PMC article.
-
Protection of neonatal macaques against experimental SHIV infection by human neutralizing monoclonal antibodies.Transfus Clin Biol. 2001 Aug;8(4):350-8. doi: 10.1016/s1246-7820(01)00187-2. Transfus Clin Biol. 2001. PMID: 11642027 Review.
-
Passive immunization with human neutralizing monoclonal antibodies: correlates of protective immunity against HIV.Vaccine. 2002 May 6;20(15):1956-60. doi: 10.1016/s0264-410x(02)00077-4. Vaccine. 2002. PMID: 11983253 Review.
Cited by
-
Beyond binding: antibody effector functions in infectious diseases.Nat Rev Immunol. 2018 Jan;18(1):46-61. doi: 10.1038/nri.2017.106. Epub 2017 Oct 24. Nat Rev Immunol. 2018. PMID: 29063907 Free PMC article. Review.
-
Broadly neutralizing antibodies for HIV prevention: a comprehensive review and future perspectives.Clin Microbiol Rev. 2024 Jun 13;37(2):e0015222. doi: 10.1128/cmr.00152-22. Epub 2024 Apr 30. Clin Microbiol Rev. 2024. PMID: 38687039 Review.
-
Early antibody therapy can induce long-lasting immunity to SHIV.Nature. 2017 Mar 23;543(7646):559-563. doi: 10.1038/nature21435. Epub 2017 Mar 13. Nature. 2017. PMID: 28289286 Free PMC article.
-
Prospecting for an HIV vaccine.Trop Dis Travel Med Vaccines. 2017 Mar 24;3:6. doi: 10.1186/s40794-017-0050-4. eCollection 2017. Trop Dis Travel Med Vaccines. 2017. PMID: 28883976 Free PMC article. Review.
-
Use of broadly neutralizing antibodies for HIV-1 prevention.Immunol Rev. 2017 Jan;275(1):296-312. doi: 10.1111/imr.12511. Immunol Rev. 2017. PMID: 28133803 Free PMC article. Review.
References
-
- Archin NM, Vaidya NK, Kuruc JD, Liberty AL, Wiegand A, Kearney MF, Cohen MS, Coffin JM, Bosch RJ, Gay CL, Eron JJ, Margolis DM, Perelson AS. 2012. Immediate antiviral therapy appears to restrict resting CD4+ cell HIV-1 infection without accelerating the decay of latent infection. Proc Natl Acad Sci U S A 109:9523–9528. doi:10.1073/pnas.1120248109. - DOI - PMC - PubMed
-
- Ananworanich J, Schuetz A, Vandergeeten C, Sereti I, de Souza M, Rerknimitr R, Dewar R, Marovich M, van Griensven F, Sekaly R, Pinyakorn S, Phanuphak N, Trichavaroj R, Rutvisuttinunt W, Chomchey N, Paris R, Peel S, Valcour V, Maldarelli F, Chomont N, Michael N, Phanuphak P, Kim JH, RV254/SEARCH 010 Study Group. 2012. Impact of multi-targeted antiretroviral treatment on gut T cell depletion and HIV reservoir seeding during acute HIV infection. PLoS One 7:e33948. doi:10.1371/journal.pone.0033948. - DOI - PMC - PubMed
-
- Whitney JB, Hill AL, Sanisetty S, Penaloza-MacMaster P, Liu J, Shetty M, Parenteau L, Cabral C, Shields J, Blackmore S, Smith JY, Brinkman AL, Peter LE, Mathew SI, Smith KM, Borducchi EN, Rosenbloom DI, Lewis MG, Hattersley J, Li B, Hesselgesser J, Geleziunas R, Robb ML, Kim JH, Michael NL, Barouch DH. 2014. Rapid seeding of the viral reservoir prior to SIV viraemia in rhesus monkeys. Nature 512:74–77. doi:10.1038/nature13594. - DOI - PMC - PubMed
Publication types
MeSH terms
Substances
Grants and funding
LinkOut - more resources
Full Text Sources
Other Literature Sources
Research Materials
Miscellaneous

