De novo transcriptome profiling of cold-stressed siliques during pod filling stages in Indian mustard (Brassica juncea L.)
- PMID: 26579175
- PMCID: PMC4626631
- DOI: 10.3389/fpls.2015.00932
De novo transcriptome profiling of cold-stressed siliques during pod filling stages in Indian mustard (Brassica juncea L.)
Abstract
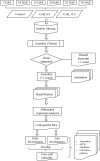
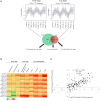
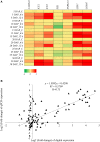
Low temperature is a major abiotic stress that impedes plant growth and development. Brassica juncea is an economically important oil seed crop and is sensitive to freezing stress during pod filling subsequently leading to abortion of seeds. To understand the cold stress mediated global perturbations in gene expression, whole transcriptome of B. juncea siliques that were exposed to sub-optimal temperature was sequenced. Manually self-pollinated siliques at different stages of development were subjected to either short (6 h) or long (12 h) durations of chilling stress followed by construction of RNA-seq libraries and deep sequencing using Illumina's NGS platform. De-novo assembly of B. juncea transcriptome resulted in 133,641 transcripts, whose combined length was 117 Mb and N50 value was 1428 bp. We identified 13,342 differentially regulated transcripts by pair-wise comparison of 18 transcriptome libraries. Hierarchical clustering along with Spearman correlation analysis identified that the differentially expressed genes segregated in two major clusters representing early (5-15 DAP) and late stages (20-30 DAP) of silique development. Further analysis led to the discovery of sub-clusters having similar patterns of gene expression. Two of the sub-clusters (one each from the early and late stages) comprised of genes that were inducible by both the durations of cold stress. Comparison of transcripts from these clusters led to identification of 283 transcripts that were commonly induced by cold stress, and were referred to as "core cold-inducible" transcripts. Additionally, we found that 689 and 100 transcripts were specifically up-regulated by cold stress in early and late stages, respectively. We further explored the expression patterns of gene families encoding for transcription factors (TFs), transcription regulators (TRs) and kinases, and found that cold stress induced protein kinases only during early silique development. We validated the digital gene expression profiles of selected transcripts by qPCR and found a high degree of concordance between the two analyses. To our knowledge this is the first report of transcriptome sequencing of cold-stressed B. juncea siliques. The data generated in this study would be a valuable resource for not only understanding the cold stress signaling pathway but also for introducing cold hardiness in B. juncea.
Keywords: Brassica juncea; RNA-seq; cold stress; low temperature; silique; transcriptome.
Figures


Similar articles
-
De novo transcriptome sequencing and gene expression profiling of Magnolia wufengensis in response to cold stress.BMC Plant Biol. 2019 Jul 18;19(1):321. doi: 10.1186/s12870-019-1933-5. BMC Plant Biol. 2019. PMID: 31319815 Free PMC article.
-
Global insights into high temperature and drought stress regulated genes by RNA-Seq in economically important oilseed crop Brassica juncea.BMC Plant Biol. 2015 Jan 21;15:9. doi: 10.1186/s12870-014-0405-1. BMC Plant Biol. 2015. PMID: 25604693 Free PMC article.
-
A comprehensive transcriptome analysis of silique development and dehiscence in Arabidopsis and Brassica integrating genotypic, interspecies and developmental comparisons.GM Crops Food. 2014;5(4):302-20. doi: 10.4161/21645698.2014.947827. GM Crops Food. 2014. PMID: 25523176 Free PMC article.
-
De Novo Assembly and Characterization of Stress Transcriptome in a Salinity-Tolerant Variety CS52 of Brassica juncea.PLoS One. 2015 May 13;10(5):e0126783. doi: 10.1371/journal.pone.0126783. eCollection 2015. PLoS One. 2015. PMID: 25970274 Free PMC article.
-
Utilization of crop wild relatives for biotic and abiotic stress management in Indian mustard [Brassica juncea (L.) Czern. & Coss.].Front Plant Sci. 2023 Oct 25;14:1277922. doi: 10.3389/fpls.2023.1277922. eCollection 2023. Front Plant Sci. 2023. PMID: 37954999 Free PMC article. Review.
Cited by
-
How to build a fruit: Transcriptomics of a novel fruit type in the Brassiceae.PLoS One. 2019 Jul 18;14(7):e0209535. doi: 10.1371/journal.pone.0209535. eCollection 2019. PLoS One. 2019. PMID: 31318861 Free PMC article.
-
Integrated Transcriptomics and Metabolomics Analysis Reveal Key Metabolism Pathways Contributing to Cold Tolerance in Peanut.Front Plant Sci. 2021 Nov 24;12:752474. doi: 10.3389/fpls.2021.752474. eCollection 2021. Front Plant Sci. 2021. PMID: 34899780 Free PMC article.
-
Full-length transcriptome sequencing provides insights into alternative splicing under cold stress in peanut.Front Plant Sci. 2024 Mar 7;15:1362277. doi: 10.3389/fpls.2024.1362277. eCollection 2024. Front Plant Sci. 2024. PMID: 38516669 Free PMC article.
-
De novo transcriptome sequencing and gene expression profiling of Magnolia wufengensis in response to cold stress.BMC Plant Biol. 2019 Jul 18;19(1):321. doi: 10.1186/s12870-019-1933-5. BMC Plant Biol. 2019. PMID: 31319815 Free PMC article.
-
Thiourea priming enhances salt tolerance through co-ordinated regulation of microRNAs and hormones in Brassica juncea.Sci Rep. 2017 Apr 6;7:45490. doi: 10.1038/srep45490. Sci Rep. 2017. PMID: 28382938 Free PMC article.
References
-
- Antikainen M., Griffith M. (1997). Antifreeze protein accumulation in freezing tolerant cereals. Physiol. Plant. 99, 423–432. 10.1111/j.1399-3054.1997.tb00556.x - DOI
LinkOut - more resources
Full Text Sources
Other Literature Sources
Molecular Biology Databases
Miscellaneous

