

The CSB chromatin remodeler and CTCF architectural protein cooperate in response to oxidative stress
- PMID: 26578602
- PMCID: PMC4797267
- DOI: 10.1093/nar/gkv1219
The CSB chromatin remodeler and CTCF architectural protein cooperate in response to oxidative stress
Abstract
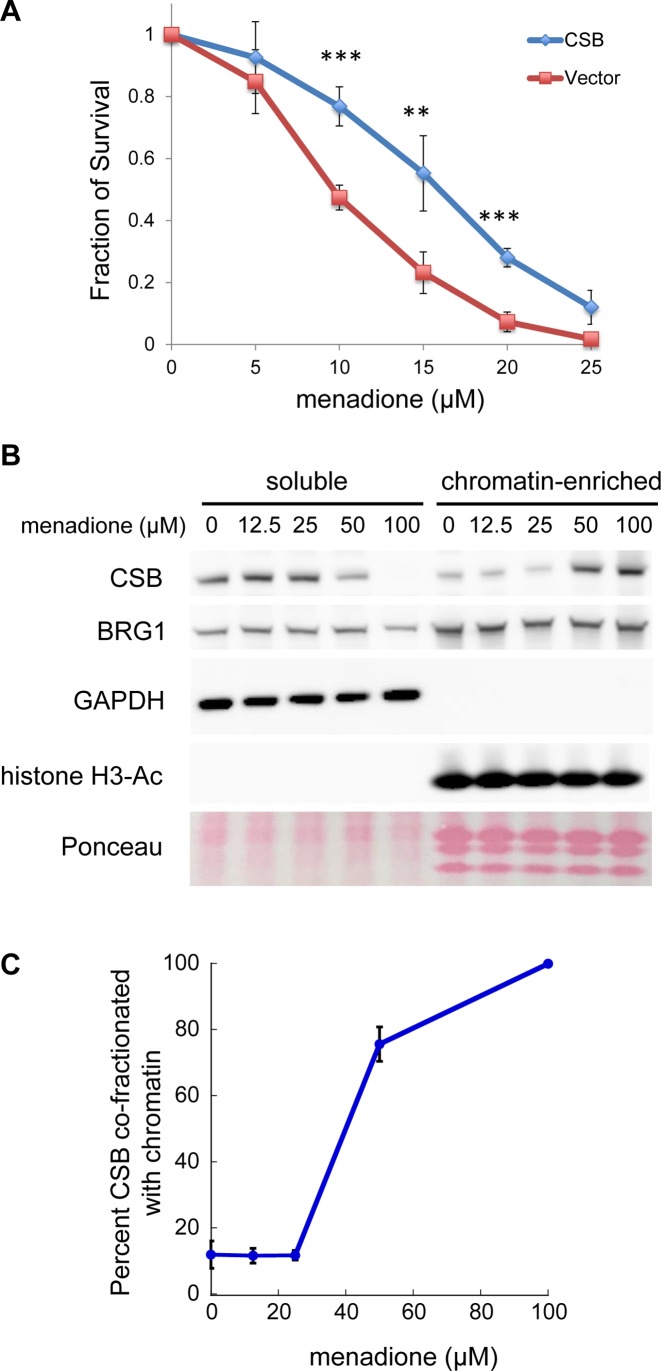
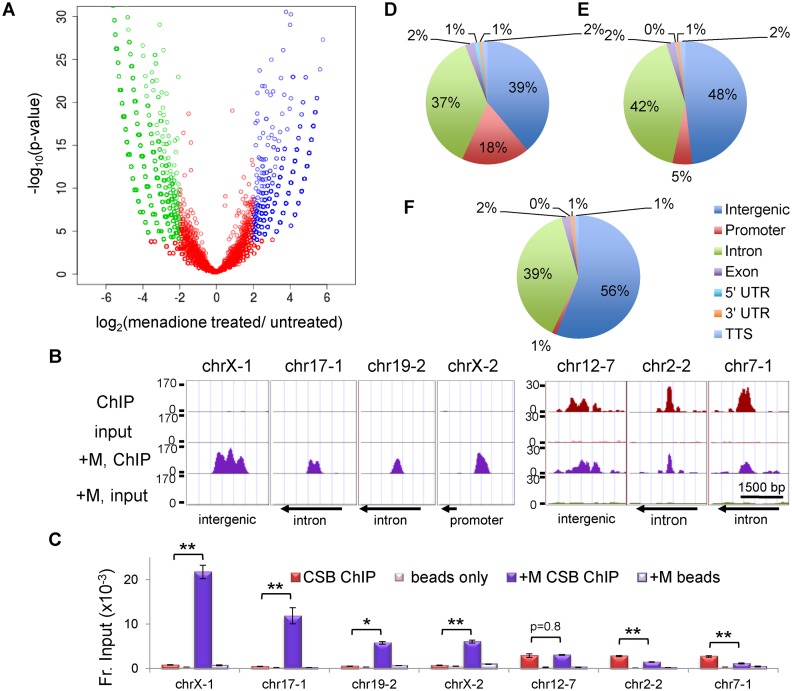
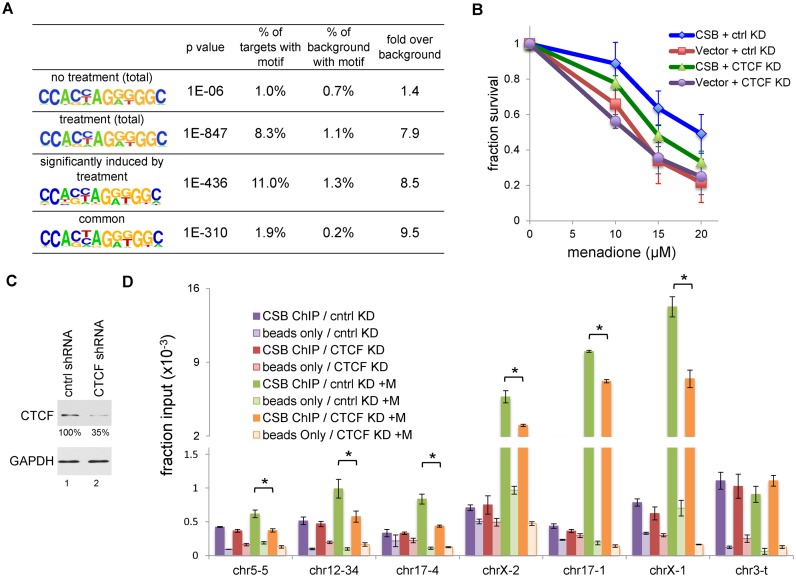
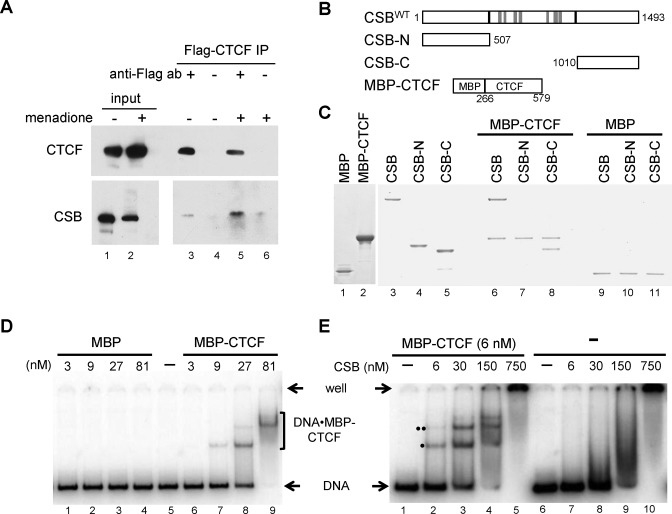
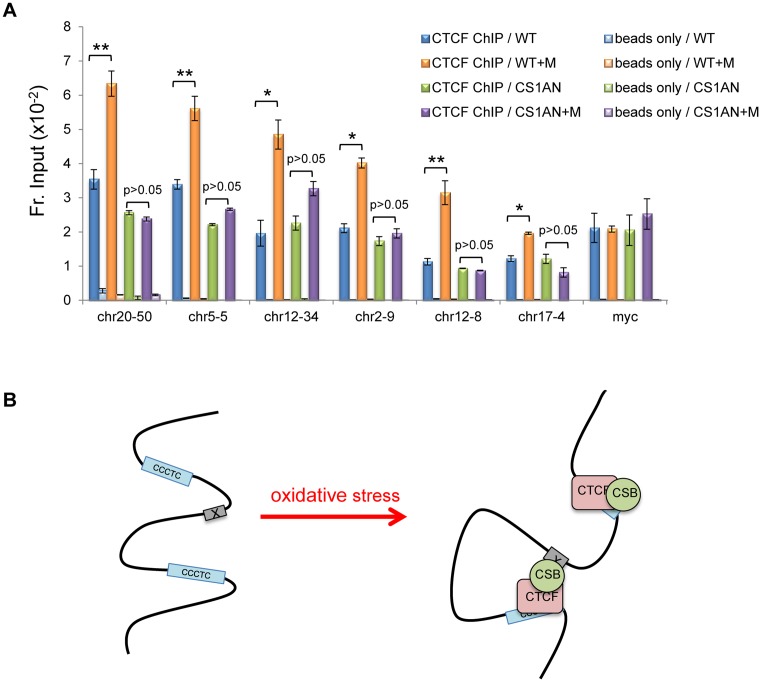
Cockayne syndrome is a premature aging disease associated with numerous developmental and neurological abnormalities, and elevated levels of reactive oxygen species have been found in cells derived from Cockayne syndrome patients. The majority of Cockayne syndrome cases contain mutations in the ATP-dependent chromatin remodeler CSB; however, how CSB protects cells from oxidative stress remains largely unclear. Here, we demonstrate that oxidative stress alters the genomic occupancy of the CSB protein and increases CSB occupancy at promoters. Additionally, we found that the long-range chromatin-structure regulator CTCF plays a pivotal role in regulating sites of genomic CSB occupancy upon oxidative stress. We show that CSB directly interacts with CTCF in vitro and that oxidative stress enhances the CSB-CTCF interaction in cells. Reciprocally, we demonstrate that CSB facilitates CTCF-DNA interactions in vitro and regulates CTCF-chromatin interactions in oxidatively stressed cells. Together, our results indicate that CSB and CTCF can regulate each other's chromatin association, thereby modulating chromatin structure and coordinating gene expression in response to oxidative stress.
© The Author(s) 2015. Published by Oxford University Press on behalf of Nucleic Acids Research.
Figures
Similar articles
-
Poly(ADP-ribose) polymerase 1 (PARP1) promotes oxidative stress-induced association of Cockayne syndrome group B protein with chromatin.J Biol Chem. 2018 Nov 16;293(46):17863-17874. doi: 10.1074/jbc.RA118.004548. Epub 2018 Sep 28. J Biol Chem. 2018. PMID: 30266807 Free PMC article.
-
Cockayne syndrome group B deficiency reduces H3K9me3 chromatin remodeler SETDB1 and exacerbates cellular aging.Nucleic Acids Res. 2019 Sep 19;47(16):8548-8562. doi: 10.1093/nar/gkz568. Nucleic Acids Res. 2019. PMID: 31276581 Free PMC article.
-
The sequence-specific transcription factor c-Jun targets Cockayne syndrome protein B to regulate transcription and chromatin structure.PLoS Genet. 2014 Apr 17;10(4):e1004284. doi: 10.1371/journal.pgen.1004284. eCollection 2014 Apr. PLoS Genet. 2014. PMID: 24743307 Free PMC article.
-
Structure, function and regulation of CSB: a multi-talented gymnast.Mech Ageing Dev. 2013 May-Jun;134(5-6):202-11. doi: 10.1016/j.mad.2013.02.004. Epub 2013 Feb 16. Mech Ageing Dev. 2013. PMID: 23422418 Free PMC article. Review.
-
What role (if any) does the highly conserved CSB-PGBD3 fusion protein play in Cockayne syndrome?Mech Ageing Dev. 2013 May-Jun;134(5-6):225-33. doi: 10.1016/j.mad.2013.01.001. Epub 2013 Jan 28. Mech Ageing Dev. 2013. PMID: 23369858 Free PMC article. Review.
Cited by
-
ERCC2 mutations alter the genomic distribution pattern of somatic mutations and are independently prognostic in bladder cancer.Cell Genom. 2024 Aug 14;4(8):100627. doi: 10.1016/j.xgen.2024.100627. Epub 2024 Aug 2. Cell Genom. 2024. PMID: 39096913 Free PMC article.
-
Blockage of ERCC6 Alleviates Spinal Cord Injury Through Weakening Apoptosis, Inflammation, Senescence, and Oxidative Stress.Front Mol Biosci. 2022 Feb 22;9:853654. doi: 10.3389/fmolb.2022.853654. eCollection 2022. Front Mol Biosci. 2022. PMID: 35392536 Free PMC article.
-
Reassessment of oxidative stress in idiopathic sudden hearing loss and preliminary exploration of the effect of physiological concentration of melatonin on prognosis.Front Neurol. 2023 Sep 6;14:1249312. doi: 10.3389/fneur.2023.1249312. eCollection 2023. Front Neurol. 2023. PMID: 37745649 Free PMC article.
-
Heterochromatin: an epigenetic point of view in aging.Exp Mol Med. 2020 Sep;52(9):1466-1474. doi: 10.1038/s12276-020-00497-4. Epub 2020 Sep 4. Exp Mol Med. 2020. PMID: 32887933 Free PMC article. Review.
-
Mechanistic insights into the regulation of transcription and transcription-coupled DNA repair by Cockayne syndrome protein B.Nucleic Acids Res. 2018 Sep 6;46(15):7471-7479. doi: 10.1093/nar/gky660. Nucleic Acids Res. 2018. PMID: 30032309 Free PMC article.
References
-
- Nance M.A., Berry S.A. Cockayne syndrome: review of 140 cases. Am. J. Med. Genet. 1992;42:68–84. - PubMed
-
- Pascucci B., Lemma T., Iorio E., Giovannini S., Vaz B., Iavarone I., Calcagnile A., Narciso L., Degan P., Podo F., et al. An altered redox balance mediates the hypersensitivity of Cockayne syndrome primary fibroblasts to oxidative stress. Aging Cell. 2012;11:520–529. - PubMed
-
- Cleaver J.E., Bezrookove V., Revet I., Huang E.J. Conceptual developments in the causes of Cockayne syndrome. Mech. Ageing Dev. 2013;134:284–290. - PubMed
Publication types
MeSH terms
Substances
Grants and funding
LinkOut - more resources
Full Text Sources
Other Literature Sources
Molecular Biology Databases
