. 2016 Feb;33(2):501-17.
doi: 10.1093/molbev/msv248. Epub 2015 Nov 17.

Shared Genetic Signals of Hypoxia Adaptation in Drosophila and in High-Altitude Human Populations

Affiliations

Shared Genetic Signals of Hypoxia Adaptation in Drosophila and in High-Altitude Human Populations

Aashish R Jha et al. Mol Biol Evol. 2016 Feb.

Abstract

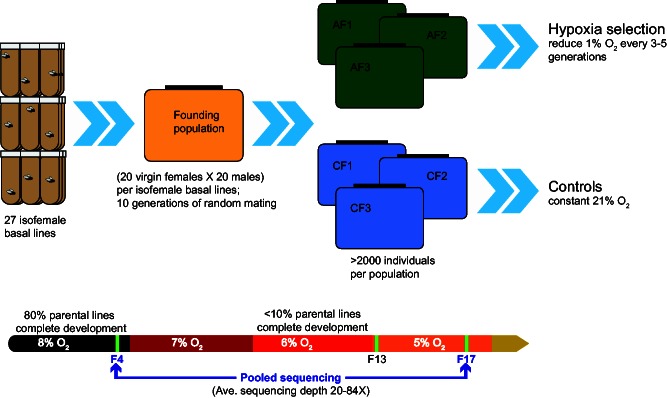
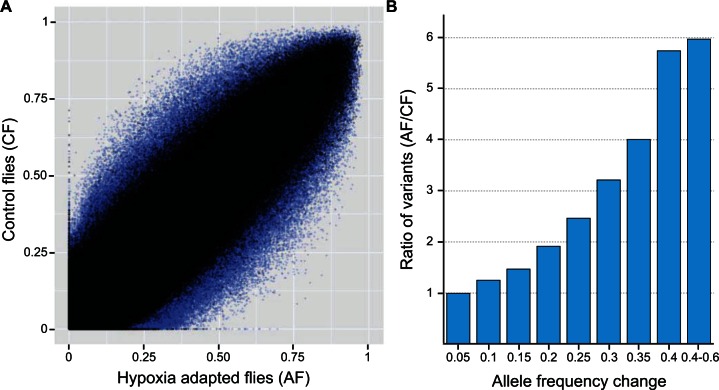
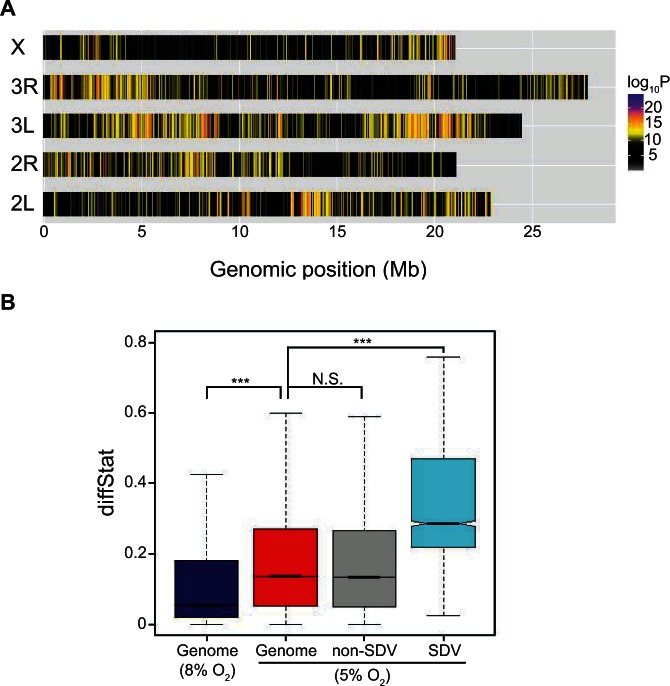
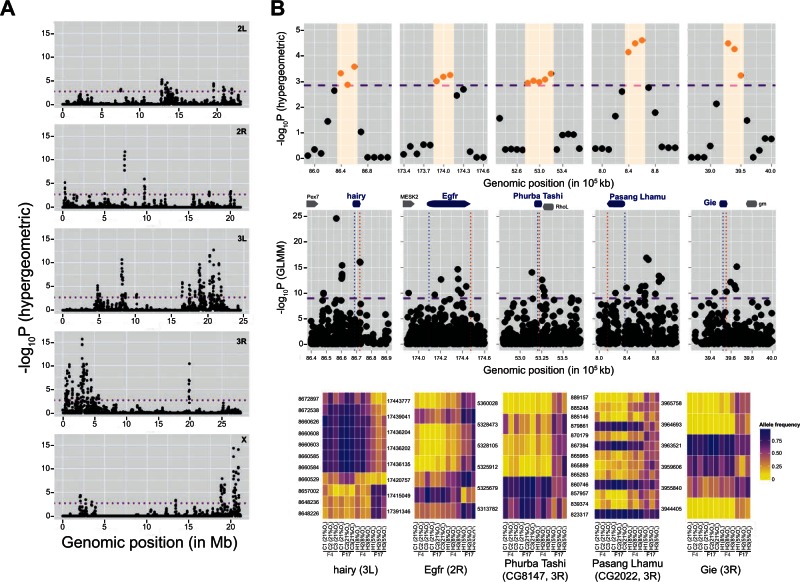
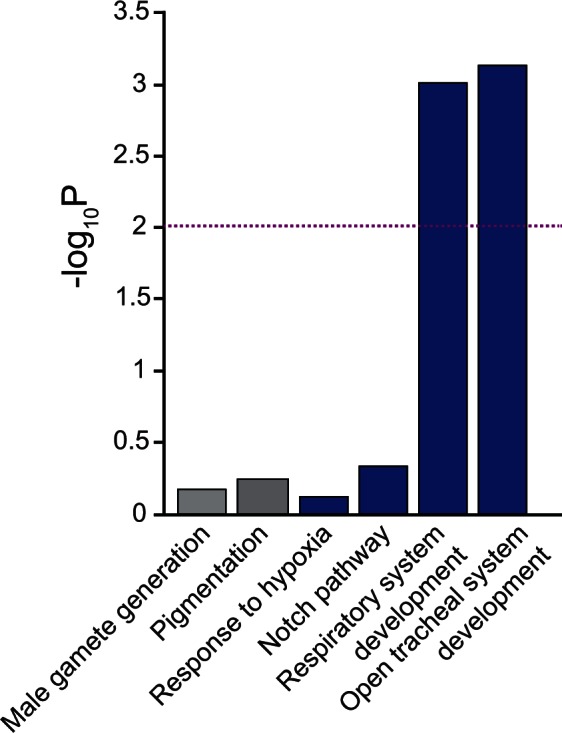
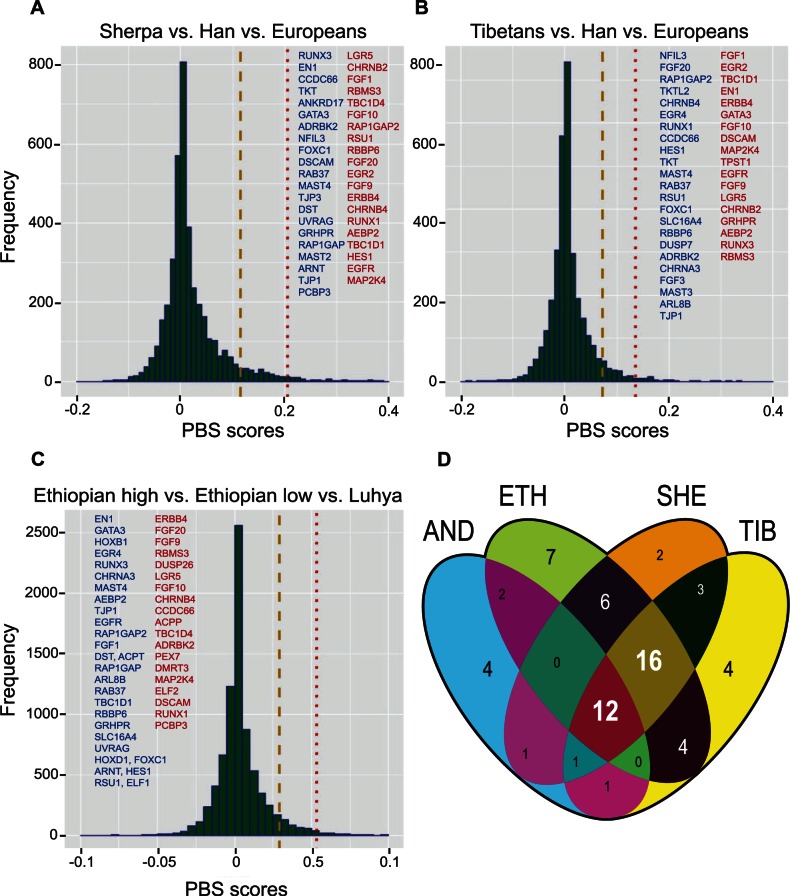
The ability to withstand low oxygen (hypoxia tolerance) is a polygenic and mechanistically conserved trait that has important implications for both human health and evolution. However, little is known about the diversity of genetic mechanisms involved in hypoxia adaptation in evolving populations. We used experimental evolution and whole-genome sequencing in Drosophila melanogaster to investigate the role of natural variation in adaptation to hypoxia. Using a generalized linear mixed model we identified significant allele frequency differences between three independently evolved hypoxia-tolerant populations and normoxic control populations for approximately 3,800 single nucleotide polymorphisms. Around 50% of these variants are clustered in 66 distinct genomic regions. These regions contain genes that are differentially expressed between hypoxia-tolerant and normoxic populations and several of the differentially expressed genes are associated with metabolic processes. Additional genes associated with respiratory and open tracheal system development also show evidence of directional selection. RNAi-mediated knockdown of several candidate genes' expression significantly enhanced survival in severe hypoxia. Using genomewide single nucleotide polymorphism data from four high-altitude human populations-Sherpas, Tibetans, Ethiopians, and Andeans, we found that several human orthologs of the genes under selection in flies are also likely under positive selection in all four high-altitude human populations. Thus, our results indicate that selection for hypoxia tolerance can act on standing genetic variation in similar genes and pathways present in organisms diverged by hundreds of millions of years.

Keywords: adaptation; complex traits; evolution; evolve and resequence; experimental evolution; high-altitude adaptation; hypoxia; polygenic traits; pooled sequencing.


Figures

F<sc>ig</sc>. 1.
Fig. 1.
Schematic representation of experimental evolution. Top: Twenty-seven isofemale lines were used to create a founding population (yellow box), which was subdivided into six replicate subpopulations. Three of these subpopulations were maintained at room oxygen levels (21%) and were used as controls (CF, blue boxes) and three were exposed to hypoxia (AF, green boxes). Bottom: Low oxygen tolerance by AF populations. Hypoxia was initiated at 8% O2, which has little impact on development of parental lines. Although less than 10% of the parental lines yield any survivors at 6% O2, individuals from AF populations were able to survive and reproduce at even stronger hypoxic conditions (5% O2) by the 13th generation (F13). Blue arrows indicate the two generations (F4 and F17) that were sequenced.
F<sc>ig</sc>. 2.
Fig. 2.
Allele frequency changes after hypoxia selection. (A) Allele frequencies in hypoxia adapted and normoxic control flies in the 4th generation (black) and in the 17th generation (blue). Each dot is the average allele frequency for each variant across the three replicates for each treatment. (B) Allele frequency changes between the 4th and 17th generations in AF populations relative to allele frequency changes between the 4th and 17th generations in CF populations. The x axis represents magnitude of allele frequency differences (in 5% bins). The y axis shows the ratio of number of variants that changed in frequencies represented by the values on the x axis. Ratios were calculated by counting the number of variants that changed at a given frequency in all three AF populations divided by the number of variants that changed at a given frequency in all three CF populations.
F<sc>ig</sc>. 3.
Fig. 3.
Distribution of SDV and diffStat scores. (A) Distribution of SDV in the five major chromosomal arms of the Drosophila melanogaster genome. Colors indicate the −log10(P value) obtained from the GLMM for each variant. (B) Comparison of whole-genome diffStat scores before (blue) and after the onset of hypoxia (red). Compared with the genomewide background and the nonsignificant variants (gray), the SDV (light blue) have much higher diffStat scores. Horizontal bars with notches indicate the median, the edges of the box indicate the interquartile range, and the whiskers indicate 1.5 times the interquartile range. ***P < 2.2 × 10⁻¹⁶, Wilcoxon rank sum test.
F<sc>ig</sc>. 4.
Fig. 4.
Candidate genomic regions under selection in AF. (A) Manhattan plots demonstrating clustering of SDV in certain genomic regions in the AF. Each dot represents a 50-kb sliding window with 10-kb steps. The dotted line shows the genomewide multiple testing threshold at FDR ≤5%. The y axes show negative log10 of P values obtained from the hypergeometric test and the x axes represent the genome size in Megabases. (B) Top panels: fine scale mapping of the genomic regions with clusters of SDV. Each dot represents a 50-kb sliding window. In each panel, orange region indicates a single differentiated block with multiple significant 50-kb windows. A differentiated block ±50-kb regions is shown in each panel. Middle panels: Differentiated block and surrounding regions from the corresponding panel in the top. Each dot represents a variant, y axis represents −log10(P value) obtained from the GLMM, and the dotted lines indicate the genomewide FDR <5% assessed using permutation tests. Genes in each region with at least one SDV are shown on top of each panel. Genes in blue are candidate hypoxia genes and the dotted lines in each panel indicate their location in that region. Bottom panels: Allele frequencies of the SDV in the corresponding middle panels in the AF and CF populations before and after hypoxia treatment. Each row is the SDV and each column is AF or CF population. Genomic co-ordinate of each SDV is listed on the left and the chromosomal arms and the candidate hypoxia genes harboring or adjacent to these SDV are listed on the bottom.
F<sc>ig</sc>. 5.
Fig. 5.
Enrichment of SDV for genes associated with hypoxia. Genes in hypoxia associated categories (blue) are enriched for SDV with extreme P values, whereas genes in control groups (gray) with no obvious functions in hypoxia are not. The y axis represents −log10 (P values) obtained from the enrichment analysis and the dotted line represents the Bonferroni adjusted P < 0.01 threshold for significance.
F<sc>ig</sc>. 6.
Fig. 6.
Functional validation of candidate genes. Drosophila stocks carrying UAS-RNAi transgenes targeting each candidate gene were crossed with da-GAL4 to knock down the expression of six candidate genes (blue bars). To ensure that response to hypoxia was not due to the genetic background carrying each transgene, we also scored the eclosion rates of flies with the general genetic background (yw), flies with Gal4 only, and lines carrying each UAS-RNAi construct (yellow bars). The progenies were cultured under hypoxic condition with 5% O2 to determine hypoxia tolerance of each cross. A significantly enhanced hypoxia tolerance was observed in the da-GAL4 crosses with UAS-RNAi-Pasang Lhamu (CG2022), UAS-RNAi-Tenzing Norgay (CG4365), UAS-RNAi-Phurba Tashi (CG8147), and UAS-RNAi-Gie. The da-GAL4 crosses with UAS-RNAi-plx showed marked decrease in hypoxia survival but statistical significance was not achieved because of low numbers. No difference in hypoxia survival was observed with da-GAL4XUAS-RNAi-uif. Each bar represents mean ± SEM of six replicate tests in two separate experiments. The significant genes with previously unknown functions were subsequently named after three Sherpa mountaineers known for their legendary ascents of Mount Everest. *P value < 0.01, Student’s t-test.
F<sc>ig</sc>. 7.
Fig. 7.
Shared genes under positive selection. Genomewide distribution of PBS scores in Sherpas (A), Tibetans (B), and Ethiopian highlanders (C). Top 5% and 1% tails of the distribution are indicated by the dashed yellow and the dotted red lines. Human orthologs of candidate genes in AFs that have at least one SNP in the top 5% and 1% tails are shown in blue and red, respectively. 41, 41, and 47 positively selected genes were identified in the Sherpas, Tibetans, and Ethiopians, respectively; and 28 are shared between all three human populations (D). Twelve of the 28 shared genes also harbor markedly divergent SNPs in Andeans (D).

Similar articles

Cited by

References

    1. 1000 Genomes Project Consortium, Abecasis GR, Altshuler D, Auton A, Brooks LD, Durbin RM, Gibbs RA, Hurles ME, McVean GA. 2010. A map of human genome variation from population-scale sequencing. Nature 467:1061–1073. - PMC - PubMed
    1. Alkorta-Aranburu G, Beall CM, Witonsky DB, Gebremedhin A, Pritchard JK, Di Rienzo A. 2012. The genetic architecture of adaptations to high altitude in Ethiopia. PLoS Genet. 8:e1003110. - PMC - PubMed
    1. Azad P, Zhou D, Zarndt R, Haddad GG. 2012. Identification of genes underlying hypoxia tolerance in Drosophila by a P-element screen. G3 (Bethesda) 2:1169–1178. - PMC - PubMed
    1. Beall CM, Cavalleri GL, Deng L, Elston RC, Gao Y, Knight J, Li C, Li JC, Liang Y, McCormack M, et al. 2010. Natural selection on EPAS1 (HIF2alpha) associated with low hemoglobin concentration in Tibetan highlanders. Proc Natl Acad Sci U S A. 107:11459–11464. - PMC - PubMed
    1. Bigham A, Bauchet M, Pinto D, Mao X, Akey JM, Mei R, Scherer SW, Julian CG, Wilson MJ, Lopez Herraez D, et al. 2010. Identifying signatures of natural selection in Tibetan and Andean populations using dense genome scan data. PLoS Genet. 6:e1001116. - PMC - PubMed

Publication types

LinkOut - more resources