. 2016 Jan 8;291(2):691-704.
doi: 10.1074/jbc.M115.648386. Epub 2015 Nov 16.

Ankyrin-G Inhibits Endocytosis of Cadherin Dimers

Affiliations

Ankyrin-G Inhibits Endocytosis of Cadherin Dimers

Chantel M Cadwell et al. J Biol Chem. .

Abstract

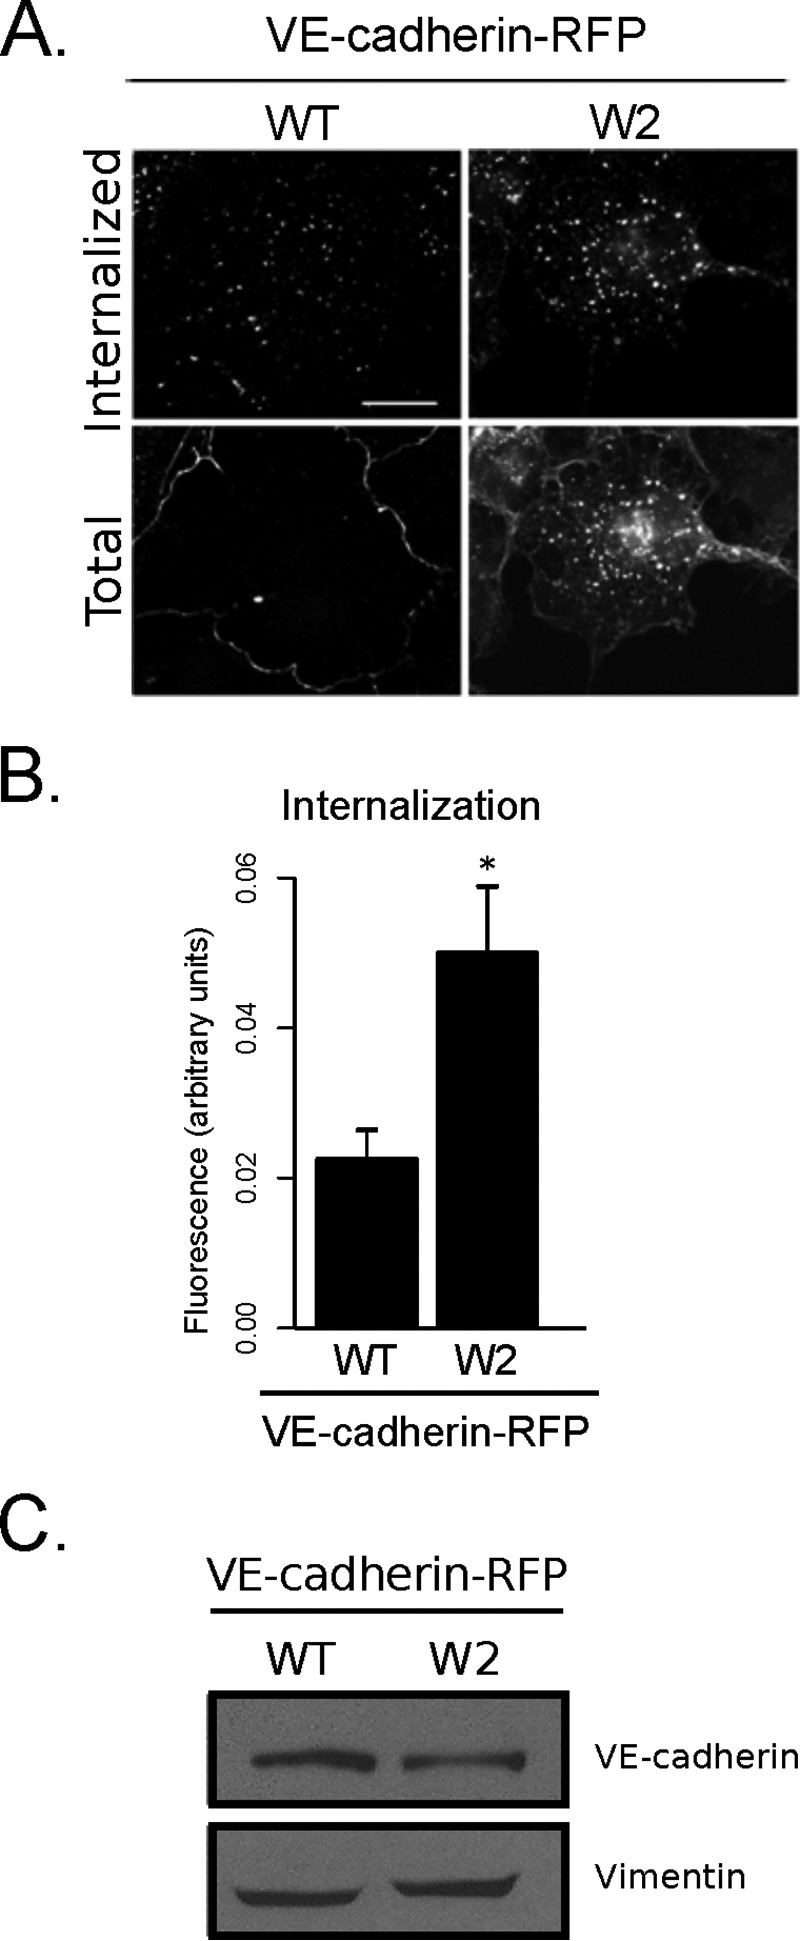
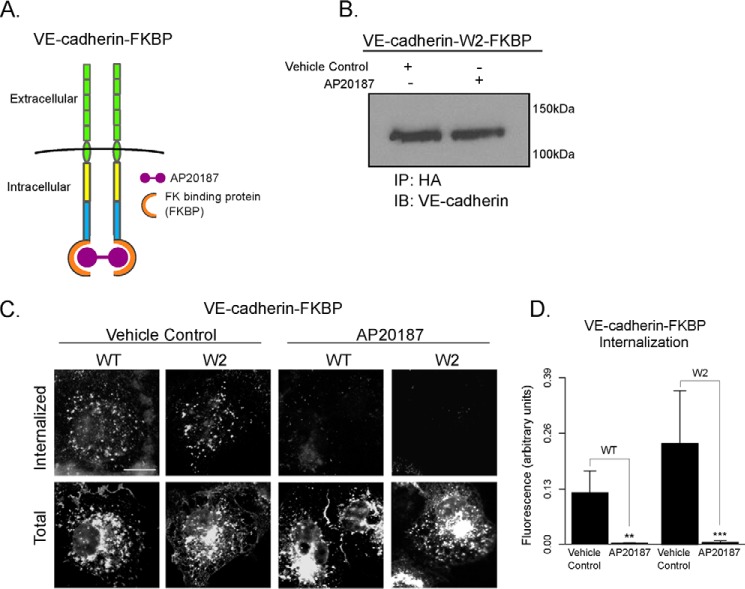
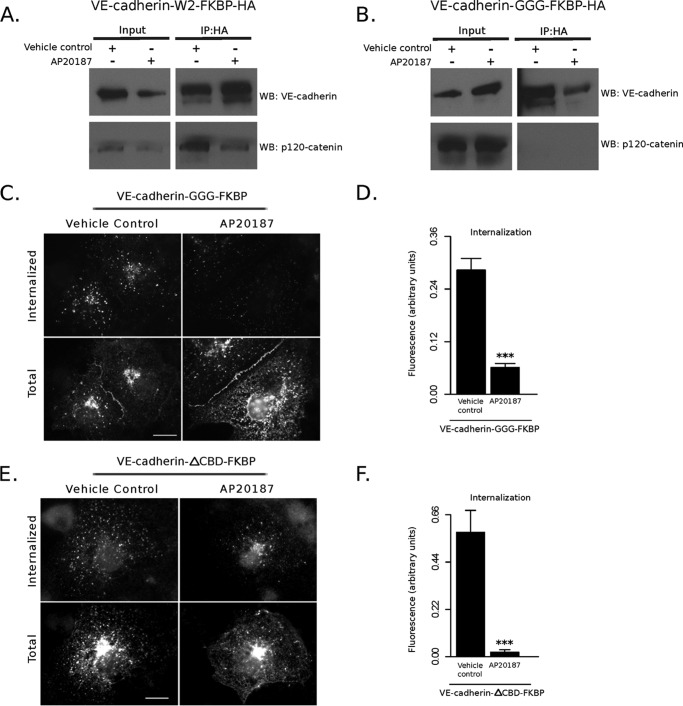
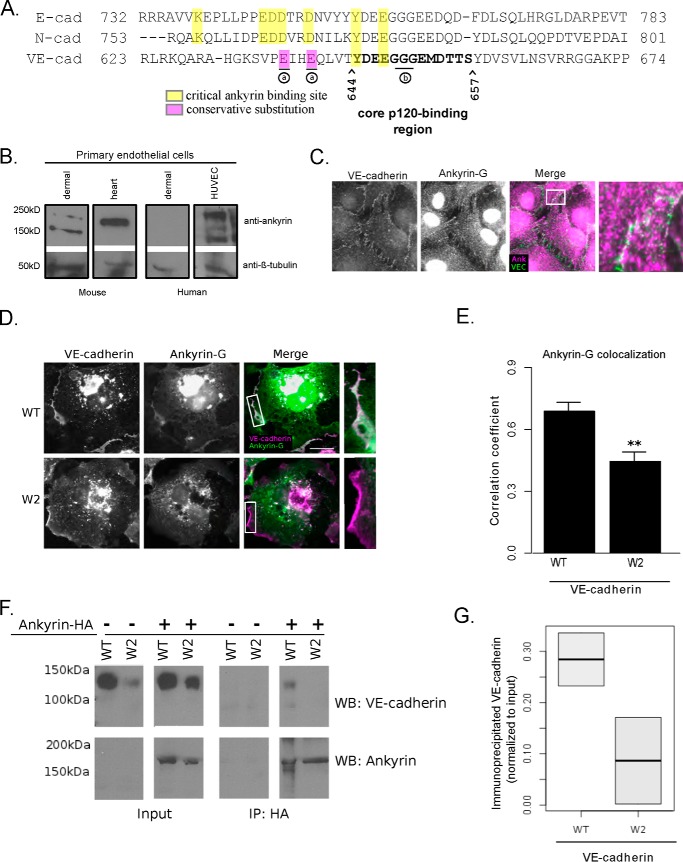
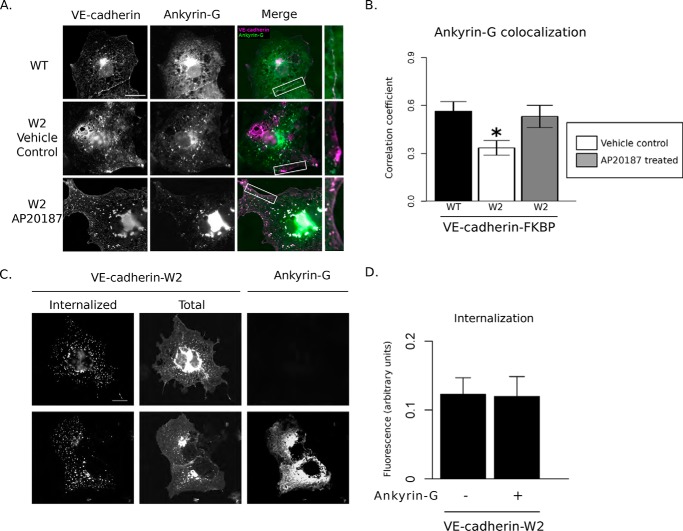
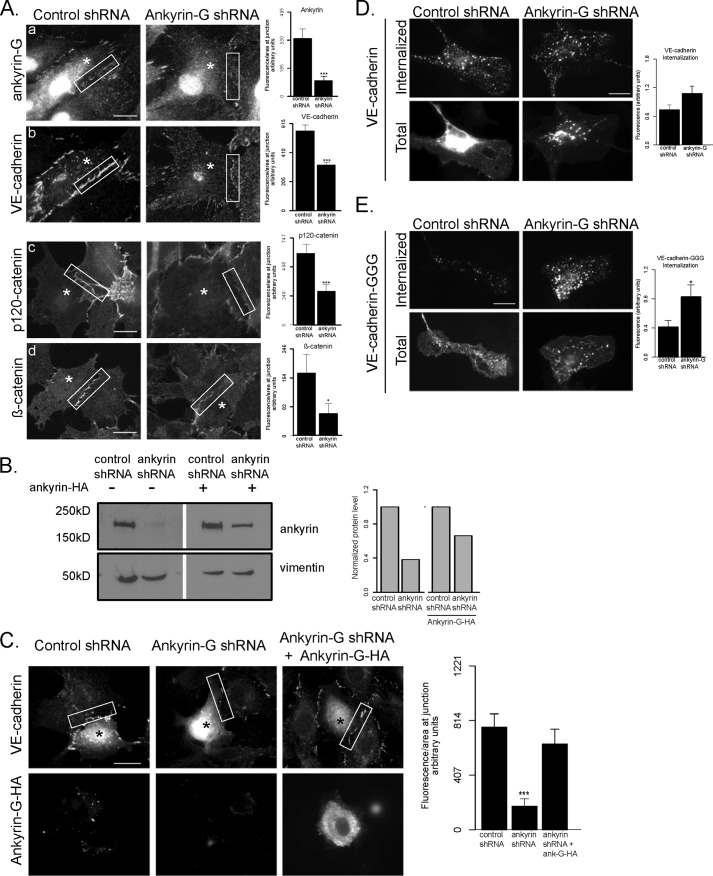
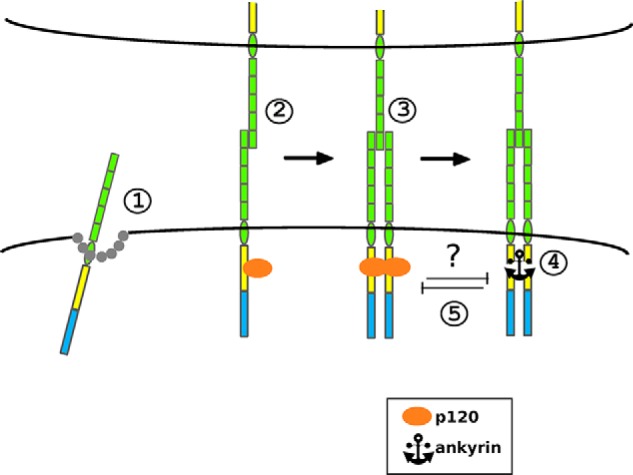
Dynamic regulation of endothelial cell adhesion is central to vascular development and maintenance. Furthermore, altered endothelial adhesion is implicated in numerous diseases. Therefore, normal vascular patterning and maintenance require tight regulation of endothelial cell adhesion dynamics. However, the mechanisms that control junctional plasticity are not fully understood. Vascular endothelial cadherin (VE-cadherin) is an adhesive protein found in adherens junctions of endothelial cells. VE-cadherin mediates adhesion through trans interactions formed by its extracellular domain. Trans binding is followed by cis interactions that laterally cluster the cadherin in junctions. VE-cadherin is linked to the actin cytoskeleton through cytoplasmic interactions with β- and α-catenin, which serve to increase adhesive strength. Furthermore, p120-catenin binds to the cytoplasmic tail of cadherin and stabilizes it at the plasma membrane. Here we report that induced cis dimerization of VE-cadherin inhibits endocytosis independent of both p120 binding and trans interactions. However, we find that ankyrin-G, a protein that links membrane proteins to the spectrin-actin cytoskeleton, associates with VE-cadherin and inhibits its endocytosis. Ankyrin-G inhibits VE-cadherin endocytosis independent of p120 binding. We propose a model in which ankyrin-G associates with and inhibits the endocytosis of VE-cadherin cis dimers. Our findings support a novel mechanism for regulation of VE-cadherin endocytosis through ankyrin association with cadherin engaged in lateral interactions.

Keywords: adaptor protein; adherens junction; adhesion; cadherin; endocytosis; endothelial cell.


Figures

FIGURE 1.
FIGURE 1.
Mutation of conserved tryptophan (Trp-2) increases VE-cadherin internalization. A, fluorescence-based internalization assay of wild-type (left panels) or non-adhesive (Trp-2) VE-cadherin (right panels) proteins expressed in COS-7 cells. The VE-cadherin-internalized pool (top panels) was identified using anti-VE-cadherin antibody. After a 30-min internalization period, a low-pH wash was used to remove the remaining surface antibody. The total pool (bottom panels) was determined by fluorescence of the red fluorescent protein (RFP) tag fused to the C terminus of the cadherin. Scale bar = 20 μm. B, quantification of internalization, determined by normalizing the internalized pool to the total pool. Error bars represent mean ± S.E. n > 20 cells/group. *, p < 0.05. C, Western blot for expression levels of cadherin (top panel) or vimentin as a loading control (bottom panel) in COS-7 cells.
FIGURE 2.
FIGURE 2.
Induced dimerization of VE-cadherin inhibits its endocytosis independent of adhesion. A, schematic of the VE-cadherin-FKBP fusion protein. FKBP is dimerized by the cell-permeant bivalent molecule AP20187. B, isolation of HA-tagged VE-cadherin-Trp-2-FKBP by immunoprecipitation (IP) of lysate from COS-7 cells expressing the protein treated with vehicle control or AP20187 followed by Western blot for VE-cadherin. IB, immunoblot. C, internalization assay of cells expressing either wild-type VE-cadherin or VE-cadherin-Trp-2 after treatment with vehicle control or AP20187. Scale bar = 20 μm. D, quantification of the internalization assay. Error bars represent mean ± S.E. n = 10–25 cells/group. **, p < 0.01 compared with vehicle control-treated WT. ***, p < 0.001 compared with vehicle control-treated Trp-2.
FIGURE 3.
FIGURE 3.
p120-catenin binding is not required for inhibited dimer internalization. A and B, isolation of VE-cadherin-Trp-2-FKBP (A) or VE-cadherin-GGG-FKBP (B) by immunoprecipitation (IP) using an antibody against the C terminus HA tag. Shown are Western blots (WB) for VE-cadherin (top panels) and p120 (bottom panels). C and E, fluorescence-based internalization assays of VE-cadherin-GGG-FKBP (C) or VE-cadherin-ΔCBD-FKBP (E) in COS-7 cells after treatment with vehicle control (left panels) or AP20187 (right panels). Scale bars = 20 μm. D and F, quantification of internalization. Error bars represent mean ± S.E. n > 20 cell/group. ***, p < 0.001.
FIGURE 4.
FIGURE 4.
Ankyrin-G associates with the juxtamembrane domain of VE-cadherin. A, sequence alignment of the juxtamembranes of classical cadherins. Critical ankyrin-G binding sites are highlighted in yellow. Conservative substitutions are highlighted in pink. The core p120-binding region is identified by boldface print. a, VE-cadherin mutations used in Fig. 7. b, VE-cadherin mutations used in Figs. 3, 5, and 7. B, Western blot for ankyrin-G (top) and β-tubulin (bottom) as a loading control. Samples from left to right show primary mouse dermal endothelial cells or heart endothelial cells and primary human dermal microvascular endothelial cells or HUVECs. Note that only the 210-kD ankyrin-G isoform is detectable in mouse heart endothelial cells. C, immunofluorescence of VE-cadherin (VEC) and ankyrin-G (Ank) in HUVECs. The area in the white box is enlarged in the fourth panel. D, colocalization of ankyrin-G with the wild type (top panels) or the Trp-2 (bottom panels) cadherin mutant. The areas in the white rectangles are enlarged in the fourth panels. An intense perinuclear signal was excluded from the analysis. Scale bar = 20 μm. E, quantification of the colocalization in B. y Axis, Pearson's correlation coefficient. n > 20 cells/group **, p < 0.01. F, co-immunoprecipitation (IP) of cell lysates exogenously expressing either VE-cadherin or both ankyrin-G-HA and VE-cadherin. An anti-HA antibody was used to isolate ankyrin-G-HA, and Western blot analyses for VE-cadherin (top panels) and ankyrin-G (bottom panels) were performed. Cadherin proteins: WT or non-adhesive (Trp-2). G, densitometric quantification of the Western blot in D (n = 2).
FIGURE 5.
FIGURE 5.
Ankyrin-G inhibits internalization of VE-cadherin. Endocytosis of wild-type VE-cadherin (A and B), VE-cadherin-GGG (C and D), VE-cadherin-ΔCBD (E and F), or the transferrin receptor (G and H) without (A, C, E, and G, top panels) or with (A, C, E, and G, bottom panels) exogenous ankyrin-G expression was measured with a fluorescence-based internalization assay. A, asterisks mark cells in the view expressing both VE-cadherin and ankyrin-G. B and D, error bars represent mean ± S.E. n = 20 cells/group. ***, p < 0.001. F, error bars represent mean S.E. n = 10 cells/group. *, p < 0.05. H, error bars represent mean S.E. n > 20 cells/group. Scale bars = 20 μm.
FIGURE 6.
FIGURE 6.
Ankyrin-G associates with VE-cadherin dimers and does not inhibit endocytosis of the Trp-2 mutant. A, colocalization of ankyrin-G with wild-type VE-cadherin (top panels), the vehicle control-treated Trp-2 mutant (center panels), or the AP20187-treated Trp-2 mutant (bottom panels). The areas in the white rectangles are enlarged in the fourth panels. An intense perinuclear signal was excluded from the analysis. B, quantification of colocalization. y Axis, Pearson's correlation coefficient. Error bars represent mean ± S.E. n = 8 cells/group. *, p < 0.05 compared with the WT. C, internalization assay of VE-cadherin-W2 without (top panels) and with (bottom panels) exogenous ankyrin-G expression. D, quantification of internalization. Error bars represent mean ± S.E. n > 15 cells/group. Scale bars = 20 μm.
FIGURE 7.
FIGURE 7.
Ankyrin-G association is required to inhibit VE-cadherin dimer internalization. A, colocalization of ankyrin-G with the VE-cadherin-GGG mutant (top panels) or the VE-cadherin-EE-GGG mutant (bottom panels). The areas in the white rectangles are enlarged in the left panels. An intense perinuclear signal was excluded from the analysis. Scale bar = 20 μm. B, quantification of colocalization. y Axis, Pearson's correlation coefficient. Error bars represent mean ± S.E. n > 20 cells/group. *, p < 0.05 compared with VE-cadherin-GGG. C, internalization assay of VE-cadherin-EE-GGG-FKBP compared with VE-cadherin-WT and VE-cadherin-GGG in COS-7 cells. Scale bar = 20 μm. D, quantification of the internalization shown in C. Error bars represent mean ± S.E. n >15 cells. **, p < 0.01 compared with VE-cadherin-WT. E, endocytosis of VE-cadherin-EE-GGG without (top panels) and with (bottom panels) exogenous ankyrin-G expression measured with a fluorescence-based internalization assay. Scale bar = 20 μm. F, quantification of internalization. Error bars represent mean ± S.E. n > 20 cells/group. G, fluorescence-based internalization assay of VE-cadherin-EE-GGG-FKBP after treatment with vehicle control (left panels) or AP20187 (right panels). Scale bar = 20 μm. H, quantification of internalization. Error bars represent mean ± S.E. n > 25 cell/group.
FIGURE 8.
FIGURE 8.
Ankyrin-G regulates adherens junction organization in endothelial cells. A, left panel, immunofluorescence of HUVECs after transfection with luciferase shRNA (control) or ankyrin-G shRNA. Shown is the immunofluorescence of ankyrin-G (a), VE-cadherin (b), p120-catenin (c), and β-catenin (d) after transfection with luciferase shRNA or ankyrin-G shRN. Right panel, quantification. Asterisks mark transfected cells determined by mCherry expression. Rectangles highlight junctions. Scale bar = 20 μm. Error bars represent mean ± S.E. n > 15 junctions/groups. ***, p < 0.001; *, p < 0.05. B, left panel, Western blot of whole cell lysates from HUVECs after transfection with luciferase shRNA (control) or ankyrin-G shRNA. Top, ankyrin-G. Bottom, vimentin loading control. Left, shRNA only. Right, shRNA plus HA-tagged 190-kD ankyrin-G. Right panel, quantification of protein levels normalized to luciferase shRNA control or luciferase shRNA plus HA-tagged 190-kD ankyrin-G. C, left panel, immunofluorescence of HUVECs expressing control shRNA, ankyrin-G shRNA, or ankyrin-G shRNA plus HA-tagged 190-kD ankyrin-G. Top row, VE-cadherin. Bottom row, ankyrin-G-HA. The rectangles highlight cell junctions. Asterisks mark transfected cells determined by mCherry expression. Right panel, quantification of VE-cadherin at junctions. Scale bar = 20 μm. Error bars represent mean ± S.E. n > 25 junctions/groups. ***, p < 0.001. D, internalization of exogenously expressed VE-cadherin (wild-type) in HUVECs in cells transfected with luciferase shRNA or ankyrin-G shRNA. Scale bar = 20 μm. Error bars represent mean ± S.E. n > 25 cell/group. E, internalization of exogenously expressed VE-cadherin-GGG in HUVECs in cells transfected with luciferase shRNA or ankyrin-G shRNA. Scale bar = 20 μm. Error bars represent mean ± S.E. n > 30 cells/group. *, p < 0.05.
FIGURE 9.
FIGURE 9.
Model of ankyrin-G-mediated inhibition of the internalization of VE-cadherin dimers. 1, VE-cadherin monomers are internalized when not bound by p120. 2, p120 stabilizes cadherin at the plasma membrane, and trans interactions form between two VE-cadherin proteins on neighboring cells. 3, after the formation of cis interactions, p120 (3) or ankyrin-G (4) bind to and stabilize VE-cadherin. 5, whether p120 and ankyrin-G bind to VE-cadherin simultaneously is not known.

Similar articles

Cited by

References

    1. Carmeliet P. (2003) Angiogenesis in health and disease. Nat. Med. 9, 653–660 - PubMed
    1. Dejana E., Orsenigo F., and Lampugnani M. G. (2008) The role of adherens junctions and VE-cadherin in the control of vascular permeability. J. Cell Sci. 121, 2115–2122 - PubMed
    1. Vincent P. A., Xiao K., Buckley K. M., and Kowalczyk A. P. (2004) VE-cadherin: adhesion at arm's length. Am. J. Physiol. Cell Physiol. 286, C987–997 - PubMed
    1. Saito M., Tucker D. K., Kohlhorst D., Niessen C. M., and Kowalczyk A. P. (2012) Classical and desmosomal cadherins at a glance. J. Cell Sci. 125, 2547–2552 - PMC - PubMed
    1. Harris E. S., and Nelson W. J. (2010) VE-cadherin: at the front, center, and sides of endothelial cell organization and function. Curr Opin Cell Biol. 22, 651–658 - PMC - PubMed

Publication types

MeSH terms

LinkOut - more resources