. 2015 Nov 13:6:8871.
doi: 10.1038/ncomms9871.

Fluid shear triggers microvilli formation via mechanosensitive activation of TRPV6

Affiliations

Fluid shear triggers microvilli formation via mechanosensitive activation of TRPV6

Shigenori Miura et al. Nat Commun. .

Abstract

Microvilli are cellular membrane protrusions present on differentiated epithelial cells, which can sense and interact with the surrounding fluid environment. Biochemical and genetic approaches have identified a set of factors involved in microvilli formation; however, the underlying extrinsic regulatory mechanism of microvilli formation remains largely unknown. Here we demonstrate that fluid shear stress (FSS), an external mechanical cue, serves as a trigger for microvilli formation in human placental trophoblastic cells. We further reveal that the transient receptor potential, vanilloid family type-6 (TRPV6) calcium ion channel plays a critical role in flow-induced Ca(2+) influx and microvilli formation. TRPV6 regulates phosphorylation of Ezrin via a Ca(2+)-dependent phosphorylation of Akt; this molecular event is necessary for microvillar localization of Ezrin in response to FSS. Our findings provide molecular insight into the microvilli-mediated mechanoresponsive cellular functions, such as epithelial absorption, signal perception and mechanotransduction.


Figures

Figure 1
Figure 1. Microfluidic device for placental transfer analysis.
(a) Schematic representation of the human placental barrier. In the placenta, maternal blood comes from the spiral artery and flows into intervillous space, into which placental villi carrying fetal blood capillaries project. Syncytiotrophoblasts, the placental barrier cells that cover the placental villi, develop a microvillar surface and function as a permeable barrier between maternal and fetal blood circulation. (b) Design of the microfluidic device for human placental transfer. PDMS microchannels (width, 1 mm; height, 200 μm) that correspond to maternal and fetal blood circulation are assembled with a vitrified collagen (VC) membrane and covalently bonded by O2 plasma treatment. The maternal microchannel has a chamber structure (φ=4 mm) that mimics the wide blood space of the intervillous space. (c) Fabricated PDMS device. Maternal and fetal channels were visualized by infusing red (maternal) and blue (fetal) ink. The material transfer between the microchannels was designed to only occur through the cell layer cultured on the VC membrane. Scale bar, 1 cm.
Figure 2
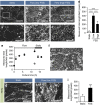
Figure 2. FSS-induced microvilli formation in trophoblastic cells.
(ac) Scanning electron microscopy surface images of BeWo cells cultured under static or flow conditions. Cells were seeded in the chamber area of the device and cultured overnight with or without medium perfusion (5 μl min−1) in both channels. For the flow-exposed cells, images were captured at the centre (low FSS) or inlet (high FSS) area of the chamber. The boxed areas in ac are magnified in a′c′, respectively. Scale bars, 20 μm (ac) or 5 μm (a′c′). (d) Quantification of microvilli. Total length of microvilli per field was measured from the SEM images (700 μm2, five fields) as described in the Methods. The data represent the mean±s.d.; ***P<0.001, analysis of variance. Representative of three independent experiments. (e,f) Time course analysis of FSS-induced microvilli formation. BeWo cells were cultured under FSS (5 μl min−1) for 12 h and then cultured without medium perfusion for additional 4 h. Culture medium was perfused only in the maternal channel/chamber (solid diamonds) or only in the fetal channel (open diamond). The cells were fixed at the indicated time points, and total length of microvilli per field (2,800 μm2, five fields) was analysed (e). The data represent the mean±s.d. The experiment was repeated twice with similar results. Note that numerous microvillar sprouts were observed 1 h after medium perfusion (f). Scale bar, 5 μm. (gi) SEM images of HVTs cultured overnight with or without medium perfusion (2 μl min−1) in both channels. Representative images (g,h) were captured at the inlet area of the chamber, and total length of microvilli per field (11,200 μm2, five fields) was measured (i). Scale bar, 20 μm. The data represent the mean±s.d.; ***P<0.001, Student's t-test.
Figure 3
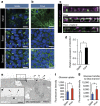
Figure 3. Microvillar localization of GLUT1 and facilitation of glucose transport in FSS-exposed BeWo cells.
Cells were seeded in the chamber area of the device and then cultured overnight under static or fluid flow (2 μl min−1) conditions. (a,b) Localization of GLUT1 (green) was analysed by immunofluorescence confocal microscopy. Nuclei were counterstained with 4′,6-diamidino-2-phenylindole (DAPI; blue). Representative x–y optical sections at apical or basal side of cells and the stacked images were shown. Scale bar, 20 μm. (c) Representative confocal images of x–z optical sections of BeWo cells stained with GLUT1 antibody (green) and phalloidin (F-actin, magenta). The lowest panel (Flow+Cyto D) shows the image derived from cells cultured under fluid flow conditions in the presence of cytochalasin D (Cyto D, 3 μM). Scale bar, 10 μm. (d) Relative mRNA expression of SLC2A1 (GLUT1) in BeWo cells cultured with or without FSS. BeWo cells were cultured overnight under static or fluid flow (2 μl min−1) conditions, and SLC2A1 mRNA expression normalized to 18S ribosomal RNA level was analysed by real-time PCR. The data are presented as the mean±s.e.m. from three independent experiments. Data significance was assessed by unpaired two-tailed Student's t-test; *P<0.05. (e) The subcellular localization of GLUT1 was analysed by immunoelectron microscopy. GLUT1 signals (arrowheads) were detected at the microvillar surface of the FSS-exposed cells. The boxed area is magnified in e′. Scale bars, 3 μm (e); 1 μm (e′). (f,g) Facilitation of glucose uptake and transfer to the fetal channel in the FSS-exposed cells. The glucose transport activity of BeWo cells was analysed by 2-NBDG (2 mM) uptake assays. The data are presented as the mean±s.d. (n=5 for each condition). Significance was assessed by unpaired two-tailed Student's t-test; *P<0.05.
Figure 4
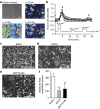
Figure 4. FSS induces Ca2+ entry and increase of intracellular [Ca2+] in BeWo cells.
(a) Representative Ca2+ responses in BeWo cells at each indicated time point. Pseudocolored images are shown: red cells indicate high levels of intracellular [Ca2+] measured by the fluorescence intensity, and blue cells represent basal levels. Scale bar, 50 μm. (b) Time course of Fura-2 fluorescence in the BeWo cells. FSS was transiently loaded by infusing the medium at flow rates of 5 (t=2.0–4.2 min), 0.5 (t=10.9–13.6) and 2 (t=18.7–21.8 min) μm min−1. The calcium response images (a) were captured at the time points indicated by arrows, respectively (t=0, 5, 23 min). Data are shown as the Fura-2 ratio (F340/F380) and mean±s.d. (n=24). (cf) Inhibition of FSS-induced microvilli formation by calcium chelators. SEM images of BeWo cells cultured under fluid flow (5 μm min−1) in the presence or absence of EGTA (1 mM) or BAPTA-AM (10 μM) for 3 h. The representative images (ce) were captured at the centre area of the chamber, and total length of microvilli per field (700 μm2, five fields) was measured (f). The data represent the mean±s.d.; **P<0.01, ***P<0.001, Student's t-test. Scale bar, 5 μm.
Figure 5
Figure 5. Involvement of TRPV6 in FSS-induced Ca2+ entry in BeWo cells.
(a) Expression of TRPV ion channels in BeWo cells was analysed by RT–PCR. Glyceraldehyde-3-phosphate-dehydrogenase (GAPDH) was used as an internal control. (b) TRPV6 knockdown was evaluated by immunoblot analysis using anti-TRPV6 antibody and anti-β-actin antibody (loading control). (c,d) Time course of Fura-2 fluorescence in the TRPV6 knockdown BeWo cells. Fluid flow (5 μl min−1) was applied from t=3 min onward, and calcium imaging was performed at the centre area of the chamber. Data shown represent the Fura-2 ratio (F340/F380) and mean±s.d. (n=33). The FSS-induced increase of the Fura-2 ratio (maximal Fura-2 ratio−basal Fura-2 ratio (t=3 min)) in c is shown as the percentage relative to the control (d). **P<0.01, Student's t-test.
Figure 6
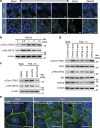
Figure 6. Essential roles of TRPV6 in FSS-induced microvilli formation.
(a) Apical localization of ezrin in the FSS-exposed BeWo cells. Cells were cultured overnight under static conditions, and then cultured with or without medium perfusion (5 μl min−1) for 1 h. Ezrin (green) localization was observed by immunofluorescence confocal microscopy. Nuclei were counterstained with 4′,6-diamidino-2-phenylindole (DAPI; blue). Serial x–y focal planes (z-sections, 0.88 μm interval in ‘Static', 0.90 μm in ‘Flow') and the stacked images are shown. Scale bar, 20 μm. (b) Time-course phosphorylation of Ezrin (pThr567) and Akt (pSer473) in response to FSS. BeWo cells were cultured overnight under static conditions and exposed to FSS (5 μl min−1) for the indicated times. The cells were lysed, and protein expression level or phosphorylation was analysed by immunoblotting. (c) Inhibition of Akt phosphorylation by BAPTA-AM. Gö6793 (100 nM), BAPTA-AM (10 μM) or buffer control (DMSO) was added to the perfusing medium. (d) Involvement of TRPV6 in the FSS-induced Ezrin phosphorylation. BeWo cells transfected with siRNA were seeded in the chamber area of the device and cultured overnight under static conditions before exposure to FSS for 1 h. β-Actin was used as a loading control. Note that the TRPV6 siRNA oligo (TRPV6 si-#1 or #2), as well as the siRNA pool, shows similar inhibitory effects on the FSS-induced phosphorylation of Ezrin and Akt. (e) Impaired Ezrin localization in the TRPV6 knockdown cells. Ezrin localization in the TRPV6 knockdown cells was analysed by immunofluorescence confocal microscopy. Note that TRPV6 knockdown cells exposed to FSS (5 μl min−1) for 1 h failed to show the microvillous localization pattern of Ezrin as observed in the control siRNA cells under FSS. Scale bar, 20 μm.

Similar articles

Cited by

References

    1. Kenny A. J. & Maroux S. Topology of microvillar membrance hydrolases of kidney and intestine. Physiol. Rev. 62, 91–128 (1982). - PubMed
    1. Du Z. et al. Mechanosensory function of microvilli of the kidney proximal tubule. Proc. Natl Acad. Sci. USA 101, 13068–13073 (2004). - PMC - PubMed
    1. Lange K. Fundamental role of microvilli in the main functions of differentiated cells: outline of an universal regulating and signaling system at the cell periphery. J. Cell. Physiol. 226, 896–927 (2011). - PubMed
    1. Al-Zuhair A. G., Ibrahim M. E., Mughal S. & Abdulla M. A. Loss and regeneration of the microvilli of human placental syncytiotrophoblast. Arch. Gynecol. 240, 147–151 (1987). - PubMed
    1. Morales F. C., Takahashi Y., Kreimann E. L. & Georgescu M. M. Ezrin-radixin-moesin (ERM)-binding phosphoprotein 50 organizes ERM proteins at the apical membrane of polarized epithelia. Proc. Natl Acad. Sci. USA 101, 17705–17710 (2004). - PMC - PubMed

Publication types

LinkOut - more resources