Investigation into the effects of antioxidant-rich extract of Tamarindus indica leaf on antioxidant enzyme activities, oxidative stress and gene expression profiles in HepG2 cells
- PMID: 26557426
- PMCID: PMC4636403
- DOI: 10.7717/peerj.1292
Investigation into the effects of antioxidant-rich extract of Tamarindus indica leaf on antioxidant enzyme activities, oxidative stress and gene expression profiles in HepG2 cells
Abstract
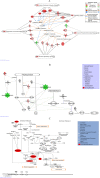
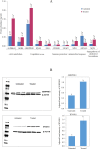
The leaf extract of Tamarindus indica L. (T. indica) had been reported to possess high phenolic content and showed high antioxidant activities. In this study, the effects of the antioxidant-rich leaf extract of the T. indica on lipid peroxidation, antioxidant enzyme activities, H2O2-induced ROS production and gene expression patterns were investigated in liver HepG2 cells. Lipid peroxidation and ROS production were inhibited and the activity of antioxidant enzymes superoxide dismutase, catalase and glutathione peroxidase was enhanced when the cells were treated with the antioxidant-rich leaf extract. cDNA microarray analysis revealed that 207 genes were significantly regulated by at least 1.5-fold (p < 0.05) in cells treated with the antioxidant-rich leaf extract. The expression of KNG1, SERPINC1, SERPIND1, SERPINE1, FGG, FGA, MVK, DHCR24, CYP24A1, ALDH6A1, EPHX1 and LEAP2 were amongst the highly regulated. When the significantly regulated genes were analyzed using Ingenuity Pathway Analysis software, "Lipid Metabolism, Small Molecule Biochemistry, Hematological Disease" was the top biological network affected by the leaf extract, with a score of 36. The top predicted canonical pathway affected by the leaf extract was the coagulation system (P < 2.80 × 10(-6)) followed by the superpathway of cholesterol biosynthesis (P < 2.17 × 10(-4)), intrinsic prothrombin pathway (P < 2.92 × 10(-4)), Immune Protection/Antimicrobial Response (P < 2.28 × 10(-3)) and xenobiotic metabolism signaling (P < 2.41 × 10(-3)). The antioxidant-rich leaf extract of T. indica also altered the expression of proteins that are involved in the Coagulation System and the Intrinsic Prothrombin Activation Pathway (KNG1, SERPINE1, FGG), Superpathway of Cholesterol Biosynthesis (MVK), Immune protection/antimicrobial response (IFNGR1, LEAP2, ANXA3 and MX1) and Xenobiotic Metabolism Signaling (ALDH6A1, ADH6). In conclusion, the antioxidant-rich leaf extract of T. indica inhibited lipid peroxidation and ROS production, enhanced antioxidant enzyme activities and significantly regulated the expression of genes and proteins involved with consequential impact on the coagulation system, cholesterol biosynthesis, xenobiotic metabolism signaling and antimicrobial response.
Keywords: Antioxidant; Enzyme-Linked Immunosorbent Assay (ELISA); Gene expression; Ingenuity Pathway Analysis; Tamarindus indica leaf; Western blotting; cDNA microarray; qRT-PCR.
Conflict of interest statement
The authors declare there are no competing interests.
Figures


Similar articles
-
Polyphenols from the extract and fraction of T. indica seeds protected HepG2 cells against oxidative stress.BMC Complement Altern Med. 2015 Dec 18;15:438. doi: 10.1186/s12906-015-0963-2. BMC Complement Altern Med. 2015. PMID: 26683054 Free PMC article.
-
In vivo biochemical and gene expression analyses of the antioxidant activities and hypocholesterolaemic properties of Tamarindus indica fruit pulp extract.PLoS One. 2013 Jul 23;8(7):e70058. doi: 10.1371/journal.pone.0070058. Print 2013. PLoS One. 2013. PMID: 23894592 Free PMC article.
-
Hypolipemic and antioxidant activities from Tamarindus indica L. pulp fruit extract in hypercholesterolemic hamsters.Food Chem Toxicol. 2006 Jun;44(6):810-8. doi: 10.1016/j.fct.2005.10.011. Epub 2005 Dec 5. Food Chem Toxicol. 2006. PMID: 16330140
-
Effects of Tamarindus indica fruit pulp extract on abundance of HepG2 cell lysate proteins and their possible consequential impact on metabolism and inflammation.Biomed Res Int. 2013;2013:459017. doi: 10.1155/2013/459017. Epub 2013 Dec 25. Biomed Res Int. 2013. PMID: 24455694 Free PMC article.
-
Tamarindus indica extract alters release of alpha enolase, apolipoprotein A-I, transthyretin and Rab GDP dissociation inhibitor beta from HepG2 cells.PLoS One. 2012;7(6):e39476. doi: 10.1371/journal.pone.0039476. Epub 2012 Jun 19. PLoS One. 2012. PMID: 22724021 Free PMC article.
Cited by
-
Nutrigenetic Interactions Might Modulate the Antioxidant and Anti-Inflammatory Status in Mastiha-Supplemented Patients With NAFLD.Front Immunol. 2021 May 7;12:683028. doi: 10.3389/fimmu.2021.683028. eCollection 2021. Front Immunol. 2021. PMID: 34025683 Free PMC article. Clinical Trial.
-
The Antidiabetic Activity of Combining the Aqueous Extracts of Vernonia amygdalina Leaves and Tamarindus indica Fruit Pulp in Streptozotocin-Induced Wistar Rats.Cureus. 2023 Oct 10;15(10):e46807. doi: 10.7759/cureus.46807. eCollection 2023 Oct. Cureus. 2023. PMID: 37954696 Free PMC article.
-
Hepatic transcriptome profile of sheep (Ovis aries) in response to overgrazing: novel genes and pathways revealed.BMC Genet. 2019 Jul 4;20(1):54. doi: 10.1186/s12863-019-0760-x. BMC Genet. 2019. PMID: 31272371 Free PMC article.
-
Identification of targets of JS-K against HBV-positive human hepatocellular carcinoma HepG2.2.15 cells with iTRAQ proteomics.Sci Rep. 2021 May 17;11(1):10381. doi: 10.1038/s41598-021-90001-3. Sci Rep. 2021. PMID: 34001947 Free PMC article.
-
Assessment of in-vitro cholinesterase inhibitory and thrombolytic potential of bark and seed extracts of Tamarindus indica (L.) relevant to the treatment of Alzheimer's disease and clotting disorders.J Intercult Ethnopharmacol. 2017 Jan 3;6(1):115-120. doi: 10.5455/jice.20161229055750. eCollection 2017 Jan-Mar. J Intercult Ethnopharmacol. 2017. PMID: 28163969 Free PMC article.
References
-
- Andreyev AY, Fahy E, Guan Z, Kelly S, Li X, McDonald JG, Milne S, Myers D, Park H, Ryan A, Thompson BM, Wang E, Zhao Y, Brown HA, Merrill AH, Raetz CR, Russell DW, Subramaniam S, Dennis EA. Subcellular organelle lipidomics in TLR-4-activated macrophages. Journal of Lipid Research. 2010;51(9):2785–2797. doi: 10.1194/jlr.M008748. - DOI - PMC - PubMed
-
- Ausubel FM, Brent R, Kingston RE, Moore DD, Seidman JG, Smith JA, Struhl K. Short protocols in molecular biology: a compendium of methods from current protocols in molecular biology. New York: John Wiley and Sons; 1999.
-
- Awah MF, Verla WA. Antioxidant activity, nitric oxide scavenging activity and phenolic contents of Ocimum gratissimum leaf extract. Journal of Medicinal Plants Research. 2010;4(24):2479–2487.
Grants and funding
LinkOut - more resources
Full Text Sources
Other Literature Sources
Molecular Biology Databases
Research Materials
Miscellaneous

