N-glycosylation Profiling of Colorectal Cancer Cell Lines Reveals Association of Fucosylation with Differentiation and Caudal Type Homebox 1 (CDX1)/Villin mRNA Expression
- PMID: 26537799
- PMCID: PMC4762531
- DOI: 10.1074/mcp.M115.051235
N-glycosylation Profiling of Colorectal Cancer Cell Lines Reveals Association of Fucosylation with Differentiation and Caudal Type Homebox 1 (CDX1)/Villin mRNA Expression
Abstract
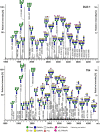
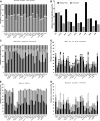
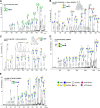
Various cancers such as colorectal cancer (CRC) are associated with alterations in protein glycosylation. CRC cell lines are frequently used to study these (glyco)biological changes and their mechanisms. However, differences between CRC cell lines with regard to their glycosylation have hitherto been largely neglected. Here, we comprehensively characterized the N-glycan profiles of 25 different CRC cell lines, derived from primary tumors and metastatic sites, in order to investigate their potential as glycobiological tumor model systems and to reveal glycans associated with cell line phenotypes. We applied an optimized, high-throughput membrane-based enzymatic glycan release for small sample amounts. Released glycans were derivatized to stabilize and differentiate between α2,3- and α2,6-linked N-acetylneuraminic acids, followed by N-glycosylation analysis by MALDI-TOF(/TOF)-MS. Our results showed pronounced differences between the N-glycosylation patterns of CRC cell lines. CRC cell line profiles differed from tissue-derived N-glycan profiles with regard to their high-mannose N-glycan content but showed a large overlap for complex type N-glycans, supporting their use as a glycobiological cancer model system. Importantly, we could show that the high-mannose N-glycans did not only occur as intracellular precursors but were also present at the cell surface. The obtained CRC cell line N-glycan features were not clearly correlated with mRNA expression levels of glycosyltransferases, demonstrating the usefulness of performing the structural analysis of glycans. Finally, correlation of CRC cell line glycosylation features with cancer cell markers and phenotypes revealed an association between highly fucosylated glycans and CDX1 and/or villin mRNA expression that both correlate with cell differentiation. Together, our findings provide new insights into CRC-associated glycan changes and setting the basis for more in-depth experiments on glycan function and regulation.
© 2016 by The American Society for Biochemistry and Molecular Biology, Inc.
Figures


Similar articles
-
N-Glycomic and Transcriptomic Changes Associated with CDX1 mRNA Expression in Colorectal Cancer Cell Lines.Cells. 2019 Mar 22;8(3):273. doi: 10.3390/cells8030273. Cells. 2019. PMID: 30909444 Free PMC article.
-
Colorectal cancer cell lines show striking diversity of their O-glycome reflecting the cellular differentiation phenotype.Cell Mol Life Sci. 2021 Jan;78(1):337-350. doi: 10.1007/s00018-020-03504-z. Epub 2020 Mar 31. Cell Mol Life Sci. 2021. PMID: 32236654 Free PMC article.
-
In-Depth Analysis of the N-Glycome of Colorectal Cancer Cell Lines.Int J Mol Sci. 2023 Mar 2;24(5):4842. doi: 10.3390/ijms24054842. Int J Mol Sci. 2023. PMID: 36902272 Free PMC article.
-
Identifying N-Glycan Biomarkers in Colorectal Cancer by Mass Spectrometry.Acc Chem Res. 2016 Oct 18;49(10):2099-2106. doi: 10.1021/acs.accounts.6b00193. Epub 2016 Sep 21. Acc Chem Res. 2016. PMID: 27653471 Review.
-
Mass Spectrometry-Based N-Glycomics of Colorectal Cancer.Int J Mol Sci. 2015 Dec 9;16(12):29278-304. doi: 10.3390/ijms161226165. Int J Mol Sci. 2015. PMID: 26690136 Free PMC article. Review.
Cited by
-
Comprehensive N-glycan profiles of hepatocellular carcinoma reveal association of fucosylation with tumor progression and regulation of FUT8 by microRNAs.Oncotarget. 2016 Sep 20;7(38):61199-61214. doi: 10.18632/oncotarget.11284. Oncotarget. 2016. PMID: 27533464 Free PMC article.
-
N-Glycoproteins Have a Major Role in MGL Binding to Colorectal Cancer Cell Lines: Associations with Overall Proteome Diversity.Int J Mol Sci. 2020 Aug 1;21(15):5522. doi: 10.3390/ijms21155522. Int J Mol Sci. 2020. PMID: 32752259 Free PMC article.
-
Correcting for sparsity and interdependence in glycomics by accounting for glycan biosynthesis.Nat Commun. 2021 Aug 17;12(1):4988. doi: 10.1038/s41467-021-25183-5. Nat Commun. 2021. PMID: 34404781 Free PMC article.
-
Fucosidases from the human gut symbiont Ruminococcus gnavus.Cell Mol Life Sci. 2021 Jan;78(2):675-693. doi: 10.1007/s00018-020-03514-x. Epub 2020 Apr 24. Cell Mol Life Sci. 2021. PMID: 32333083 Free PMC article.
-
Broad and thematic remodeling of the surfaceome and glycoproteome on isogenic cells transformed with driving proliferative oncogenes.Proc Natl Acad Sci U S A. 2020 Apr 7;117(14):7764-7775. doi: 10.1073/pnas.1917947117. Epub 2020 Mar 23. Proc Natl Acad Sci U S A. 2020. PMID: 32205440 Free PMC article.
References
-
- Ferlay J., S. I., Ervik M., Dikshit R., Eser S., Mathers C., Rebelo M., Parkin D.M., Forman D., and Bray F. (2013) Cancer incidence and mortality worldwide: IARC CancerBase No. 11. International Agency for Research on Cancer, Lyon, France
-
- Howlader N. N. A., Krapcho M., Garshell J., Miller D., Altekruse S. F., Kosary C. L., Yu M., Ruhl J., Tatalovich Z., Mariotto A., Lewis D. R., Chen H. S., Feuer E. J., and Cronin K. A. (eds). (2013) SEER Cancer Statistics Review, 1975–2011. National Cancer Institute; Bethesda, MD: http://seer.cancer.gov/csr/1975_2011/, based on November 2013 SEER data submission, posted to the SEER web site, April 2014
-
- Siegel R., Desantis C., and Jemal A. (2014) Colorectal cancer statistics, 2014. CA Cancer J. Clin. 64, 104–117 - PubMed
-
- Adamczyk B., Tharmalingam T., and Rudd P. M. (2012) Glycans as cancer biomarkers. Biochim. Biophys. Acta 1820, 1347–1353 - PubMed
Publication types
MeSH terms
Substances
LinkOut - more resources
Full Text Sources
Other Literature Sources
Medical
Research Materials

