. 2015 Nov 4;10(11):e0141657.
doi: 10.1371/journal.pone.0141657. eCollection 2015.

Transactivation of ErbB Family of Receptor Tyrosine Kinases Is Inhibited by Angiotensin-(1-7) via Its Mas Receptor

Affiliations

Transactivation of ErbB Family of Receptor Tyrosine Kinases Is Inhibited by Angiotensin-(1-7) via Its Mas Receptor

Saghir Akhtar et al. PLoS One. .

Abstract

Transactivation of the epidermal growth factor receptor (EGFR or ErbB) family members, namely EGFR and ErbB2, appears important in the development of diabetes-induced vascular dysfunction. Angiotensin-(1-7) [Ang-(1-7)] can prevent the development of hyperglycemia-induced vascular complications partly through inhibiting EGFR transactivation. Here, we investigated whether Ang-(1-7) can inhibit transactivation of ErbB2 as well as other ErbB receptors in vivo and in vitro. Streptozotocin-induced diabetic rats were chronically treated with Ang-(1-7) or AG825, a selective ErbB2 inhibitor, for 4 weeks and mechanistic studies performed in the isolated mesenteric vasculature bed as well as in cultured vascular smooth muscle cells (VSMCs). Ang-(1-7) or AG825 treatment inhibited diabetes-induced phosphorylation of ErbB2 receptor at tyrosine residues Y1221/22, Y1248, Y877, as well as downstream signaling via ERK1/2, p38 MAPK, ROCK, eNOS and IkB-α in the mesenteric vascular bed. In VSMCs cultured in high glucose (25 mM), Ang-(1-7) inhibited src-dependent ErbB2 transactivation that was opposed by the selective Mas receptor antagonist, D-Pro7-Ang-(1-7). Ang-(1-7) via Mas receptor also inhibited both Angiotensin II- and noradrenaline/norephinephrine-induced transactivation of ErbB2 and/or EGFR receptors. Further, hyperglycemia-induced transactivation of ErbB3 and ErbB4 receptors could be attenuated by Ang-(1-7) that could be prevented by D-Pro7-Ang-(1-7) in VSMC. These data suggest that Ang-(1-7) via its Mas receptor acts as a pan-ErbB inhibitor and might represent a novel general mechanism by which Ang-(1-7) exerts its beneficial effects in many disease states including diabetes-induced vascular complications.


Conflict of interest statement

Competing Interests: The authors have declared that no competing interests exist.

Figures

Fig 1
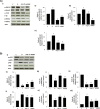
Fig 1. Diabetes-induced phosphorylation of ErbB2 receptor at multiple tyrosine residues can be attenuated by chronic treatment with Ang-(1–7) or AG825 in the mesenteric bed vasculature of STZ-induced diabetic rats.
Panel i) is a representative Western blot showing the levels of phosphorylated ErbB2 receptor (p-ErbB2) at the indicated tyrosines Y1221/1222, Y1248 (detected by two separate antibodies labeled as Y1248a and Y1248b), and Y877, total ErbB2 receptor (t-ErbB2) and β-actin in the isolated mesenteric bed from normal (non-diabetic) controls (C), diabetic (D) and diabetic animals treated for 4 weeks with either Ang-(1–7) (+A1-7) or AG825 (+AG825). Panels ii)-vii) are densitometry histograms showing band intensity ratios for levels of phosphorylated (at the stated tyrosine residue) and total ErbB2 receptor normalized to actin and presented as relative to control (ii-vi) and ratios of phosphorylated ErbB2 (Y1221/1222) receptor to total ErbB2 receptor following normalization of each to actin and presented as relative to control value (panel vii). n = 6; mean ± SD. Asterisk (*) indicates significantly different (P < 0.05) mean values from normal non-diabetic rats (C), whereas # indicates significantly different mean values (P < 0.05) from diabetic rats (D).
Fig 2
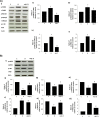
Fig 2. Chronic Ang-1-7 treatment opposes diabetes-induced signaling changes in (a) ERK1/2, p38 MAPK, ROCK2 and (b) in eNOS and NF-kB in the mesenteric vascular bed.
(a) Representative Western blot (panel i) showing the levels of phosphorylated (p-) or total (t) for ERK1/2, p38 MAPK, ROCK2 proteins and β-actin in the isolated mesenteric bed from normal controls (C), diabetic (D) and diabetic animals treated for 4 weeks with Ang-(1–7) (+A1-7) or AG825 (+AG825). Densitometry histograms showing band intensity ratios for levels of phosphorylated to total protein as stated following normalization of each to actin and presented as relative to control value (panels ii-iv). (b) Representative Western blot (panel i) showing the levels of phosphorylated (p-) or total (t) for eNOS and IkB proteins and β-actin in the isolated mesenteric bed from normal controls (C), diabetic (D) and diabetic animals treated for 4 weeks with Ang-(1–7) (+A1-7) or AG825 (+AG825). Densitometry histograms showing band intensity ratios for levels of phosphorylated (p-) or total (t) proteins normalized to actin and presented as relative to control or for ratio of phosphorylated to total protein as stated following normalization to actin and presented as relative to control value (ii-vii). n = 6; mean ± SD. *Indicates significantly different (P < 0.05) mean values from normal non-diabetic rats (C), whereas # indicates significantly different mean values (P < 0.05) from diabetic rats (D).
Fig 3
Fig 3. Acute (ex-vivo) Ang-1-7 treatment opposes diabetes-induced signaling changes in (a) ErbB2, ROCK2, ERK1/2, p38 MAPK and (b) in eNOS and NF-kB in the isolated mesenteric vascular bed.
(a) Representative Western blot (i) showing the levels of phosphorylated (p-) or total (t) for ErbB2, ROCK2, ERK1/2, p38 MAPK proteins andβ-actin in the isolated mesenteric bed from normal controls (C), diabetic (D) and diabetic animals treated for 4 weeks with Ang-(1–7) (+A1-7). Densitometry histograms showing band intensity ratios for levels of phosphorylated (p-) to total (t) as stated following normalization of each to actin and presented as relative to control (ii-v). (b) Representative Western blot (i) showing the levels of phosphorylated (p-) or total (t) for eNOS and IkB proteins and β-actin in the isolated mesenteric bed from normal controls (C), diabetic (D) and diabetic animals treated for 4 weeks with Ang-(1–7) (+A1-7) or AG825 (+AG825). Densitometry histograms showing band intensity ratios for levels of normalized phosphorylated (p-) or total (t) proteins presented as relative to control or for ratio of phosphorylated to total protein as stated following normalization of each to actin and presented as relative to control (ii-vii). n = 6; mean ± SD. Asterisk (*) indicates significantly different (P < 0.05) mean values from normal non-diabetic rats (C), # indicates significantly different mean values (P < 0.05) from diabetic rats (D) and $ indicates significantly different mean values (P < 0.05) from Ang-(1–7).
Fig 4
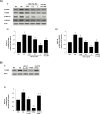
Fig 4. The effects of Ang-(1–7) on a) high glucose-induced transactivation of ErbB2 receptor at Y1221/1222 and of downstream ERK1/2 signaling and b) ErbB2 receptor expression when compared with anti-ErbB2 siRNA in VSMC.
(a) Representative Western blot (panel i) showing the levels of phosphorylated (p-) or total (t) ErbB2, or ERK1/2 and total β-actin in VSMC grown in normal (5.5mM) D-glucose (NG) or cultured for 72h in high glucose (25mM D-glucose; HG) or HG co-treated with increasing (0.01, 0.1 and 1 micromolar doses of Ang-(1–7) (+ A(1–7)) or with AG825 (0.1 micromolar). Panels ii-iii) are densitometry histograms showing band intensity ratios for levels of phosphorylated (p-) to total (t) proteins as stated following normalization of each to actin and presented as relative to NG control. N = 5; Mean ± SD. Asterisk (*) indicates significantly different (p<0.05) mean values from NG whereas hash (#) indicates significantly different mean values (p<0.05) from HG; (b) Upper panel shows a representative Western blot showing the levels of phosphorylated (p-) or total (t) ErbB2 and total β-actin in VSMC grown in normal (5.5mM) D-glucose (NG) or cultured for 72h in high glucose (25mM D-glucose; HG) or HG co-treated with 1 micromolar Ang-(1–7) (+ A(1–7)) or with a pool of anti-ErbB2 siRNA or control siRNA (at 25 nanomolar concentrations). Lower panel shows the densitometry histograms showing band intensity levels of total (t) ErbB2 receptor protein normalized to actin and presented relative to NG control. N = 4; mean ± SD. Asterisk (*) indicates significantly different (p<0.05) mean values from NG whereas hash (#) indicates significantly different mean values (p<0.05) from HG and $ indicates significantly different to +A(1–7) treatment.
Fig 5
Fig 5. High Glucose-induced ErbB2-ERK1/2 phosphorylation occurs via a src-dependent pathway that can be blocked by Ang-(1–7) via its Mas receptor.
Panel (i) is a representative Western blot showing the levels of phosphorylated Src at Y416 (p-Src), total Src (Src), phosphorylated ErbB2 receptor at Y1221/1222 (p-ErbB2), total ErbB2 receptor (t-ErbB2) and phosphorylated (p-) and total (t-) ERK1/2 in VSMC grown in normal (5.5 mM) D-glucose (NG), high glucose (25 mM) D-glucose (HG) or HG treated with increasing doses (2 and 25 micromolar) of Src selective inhibitor, SU6656 (lanes labelled as + SU6656 and the stated dose) or HG treated with either 1 micromolar Ang-(1–7) (+ A(1–7) or together with the selective Mas receptor inhibitor, D-Pro7-Ang-(1–7) (lane labeled as + D-Pro). Panels (ii-vii) are densitometry histograms showing ratio levels of phosphorylated to total proteins as stated following normalization of each to actin and presented relative to NG control. N = 5; Mean ± SD. Asterisk (*) indicates significantly different (p<0.05) mean values from NG whereas hash (#) indicates significantly different mean values (p<0.05) from HG.
Fig 6
Fig 6. Ang-(1–7) via its Mas receptor inhibits Ang II-mediated transactivation of ErbB2 receptor and downstream ERK1/2 phosphorylation in VSMC in a manner similar to that of an AT1 receptor antagonist, losartan, and AG825, a selective inhibitor of ErbB2 receptor phosphorylation.
(i) Representative Western blot showing the levels of phosphorylated (p-) or total (t-) ErbB2 receptor (Y1221/1222), or ERK1/2 and total βa-actin in VSMC grown in normal (5.5 mM) D-glucose (NG), or treated with 1 micromolar Ang II (+Ang II), or together with 1 micromolar losartan (+LOS), with 0.1 micromolar AG825 (+AG825) or 1 micromolar Ang-(1–7) (labelled as A(1–7) or together with the selective Mas receptor inhibitor, D-Pro7-Ang-(1–7) (lane labeled as A(1–7) + D-Pro); Panels ii-iii are densitometry histograms showing ratio levels of phosphorylated to total proteins as stated following normalization of each to actin and presented relative to control. N = 5; Mean ± SD. Asterisk (*) indicates significantly different (p<0.05) mean values from NG whereas hash (#) indicates significantly different mean values (p<0.05) from HG.
Fig 7
Fig 7. The dose-dependent transactivation of ErbB2 and EGFR receptor by norepinephrine in VSMC can be attenuated by the α1-adrenergic receptor inhibitor, Prazosin.
Panel (i) is a representative Western blot showing the levels of total (t-) or phosphorylated (p-) ErbB2 receptor (Y1221/1222), EGFR (Y1068) and total β-actin in VSMC grown in normal (5.5 mM) D-glucose (NG), or NG treated with increasing doses of NE or NE (10-7M) together with 1 micromolar Prazosin (labelled as NE 10−7 + PRAZ); Panels ii-iii are densitometry histograms showing ratio levels of phosphorylated to total proteins as stated following normalization of each to actin and presented relative to control. N = 5; Mean ± SD. Asterisk (*) indicates significantly different (p<0.05) mean values from NG whereas hash (#) indicates significantly different mean values (p<0.05) from NG at 10-7M dose.
Fig 8
Fig 8. Ang-(1–7) via its Mas receptor inhibits NE-mediated transactivation of (A) ErbB2 and (B) EGFR receptors in VSMC.
In both A) and B) panel (i) is a representative Western blot showing either the levels of total (t-) or phosphorylated (p-) ErbB2 receptor (Y1221/1222) or EGFR (Y1068) and total β-actin in VSMC grown in normal (5.5 mM) D-glucose (NG), or NG treated with NE (10-7M) or NE together with 1 micromolar Ang-(1–7) (+ A(1–7), or A(1–7) together with D-Pro7-Ang-(1–7) (lane labeled as + A(1–7) +D-Pro), AG1478 (1μM) or AG825 (0.1μM) or 1 micromolar Prazosin (labelled as NE 10−7 + PRAZ); Panels ii is the densitometry histogram showing ratio levels of stated phosphorylated to total proteins following normalization of each to actin and presented relative to control. N = 5; Mean ± SD. Asterisk (*) indicates significantly different (p<0.05) mean values from NG whereas hash (#) indicates significantly different mean values (p<0.05) from NG at 10-7M dose.
Fig 9
Fig 9. Chronic (in vivo) and acute (ex vivo) Ang-(1–7) treatment inhibits diabetes-induced transactivation of ErbB3 and ErbB4 receptors in the isolated mesenteric vascular bed.
Panel (i) is a representative Western blot showing the levels of total (t-) or phosphorylated (p-) ErbB3 (Y1222), ErbB4 (Y1284) receptors and total β-actin in the isolated mesenteric bed from normal controls (C), diabetic (D) and diabetic animals treated chronically for 4 weeks (lane labeled as chronic) or acutely ex vivo with 1 micromolar (lane labeled as acute) Ang-(1–7) (+A1-7). Panels ii-iii) are densitometry histograms showing ratio levels of stated phosphorylated (p-) to total (t) proteins following normalization of each to actin and presented relative to control. N = 6; mean ± SD. Asterisk (*) indicates significantly different (P < 0.05) mean values from normal non-diabetic rats (C), whereas # indicates significantly different mean values (P < 0.05) from diabetic rats (D).
Fig 10
Fig 10. Ang-(1–7) via its Mas receptor inhibits high glucose-induced transactivation of ErbB3 and ErbB4 receptors in VSMC.
Panel (i) is a representative Western blot showing the levels of total (t-) or phosphorylated (p-) ErbB3 (Y1222), ErbB4 (Y1284) receptors and total β-actin in VSMC grown in normal (5.5 mM) D-glucose (NG), or treated with 1 micromolar Ang-(1–7) (labelled as A1-7) or A(1–7) together with D-Pro7-Ang-(1–7) (+D-Pro). Panels ii-iii are densitometry histograms showing ratio levels of stated phosphorylated to total protein following normalization of each to actin and presented relative to control. N = 5; Mean ± SD. Asterisk (*) indicates significantly different (p<0.05) mean values from NG whereas hash (#) indicates significantly different mean values (p<0.05) from HG.

Similar articles

Cited by

References

    1. Gray SP, Jandeleit-Dahm K. The pathobiology of diabetic vascular complications-cardiovascular and kidney disease. J Mol Med (Berl). 2014; 92: 441–452. - PubMed
    1. Forbes JM, Cooper ME. Mechanisms of diabetic complications. Physiol Rev. 2013; 93: 137–88. 10.1152/physrev.00045.2011 - DOI - PubMed
    1. Giacco F, Brownlee M. Oxidative stress and diabetic complications. Circ Res. 2010;107: 1058–1070. 10.1161/CIRCRESAHA.110.223545 - DOI - PMC - PubMed
    1. Akhtar S, Yousif MH, Dhaunsi GS, Sarkhouh F, Chandrasekhar B, Attur S et al., (2013). Activation of ErbB2 and Downstream Signaling via Rho Kinases and ERK1/2 Contributes to Diabetes-Induced Vascular Dysfunction. PLoS One 8: e67813 - PMC - PubMed
    1. Akhtar S, Yousif MH, Dhaunsi GS, Chandrasekhar B, Al-Farsi O, Benter IF. Angiotensin-(1–7) inhibits epidermal growth factor receptor transactivation via a Mas receptor-dependent pathway. Br J Pharmacol. 2012a; 165: 1390–1400. - PMC - PubMed

Publication types

MeSH terms

Grants and funding

This study was supported by a grant from Kuwait University Research Sector/Administration (Project number MR 05/09). The authors also acknowledge support from the OMICS Research Unit / RCF and the General Facility Grant (SRUL02/13). The funders had no role in study design, data collection and analysis, decision to publish, or preparation of the manuscript.