. 2015 Dec 15;6(40):42733-48.
doi: 10.18632/oncotarget.5811.

Identification of a novel platelet antagonist that binds to CLEC-2 and suppresses podoplanin-induced platelet aggregation and cancer metastasis

Affiliations

Identification of a novel platelet antagonist that binds to CLEC-2 and suppresses podoplanin-induced platelet aggregation and cancer metastasis

Yao-Wen Chang et al. Oncotarget. .

Abstract

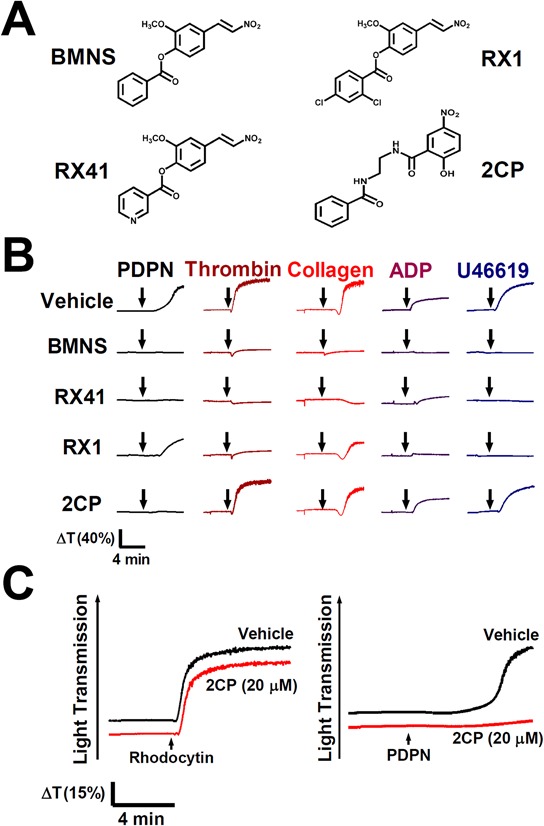
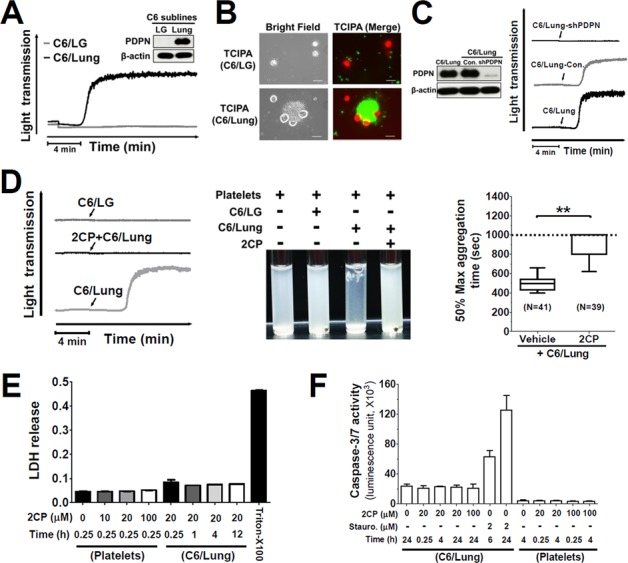
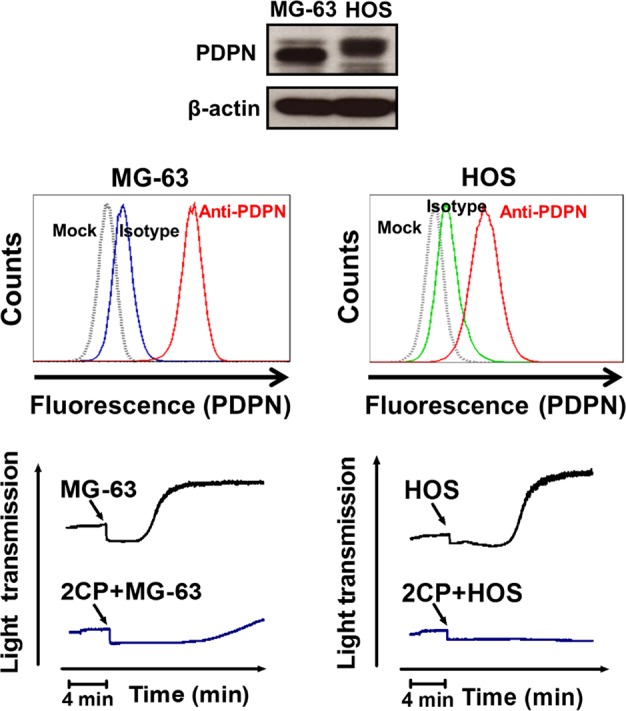
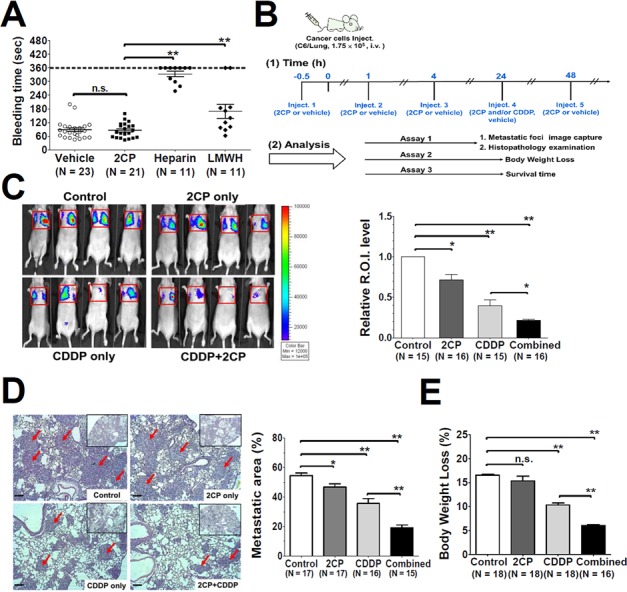
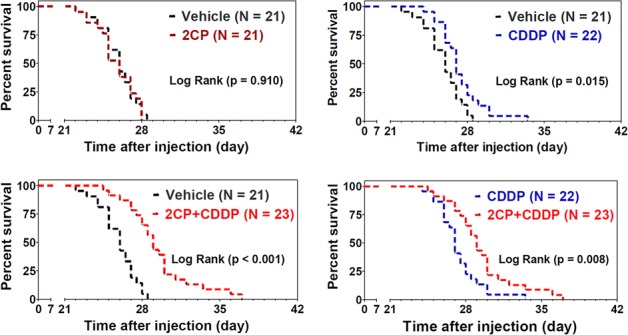
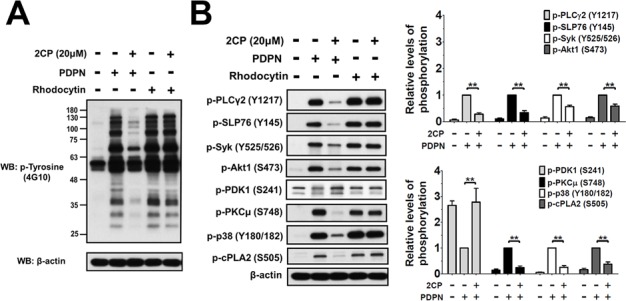
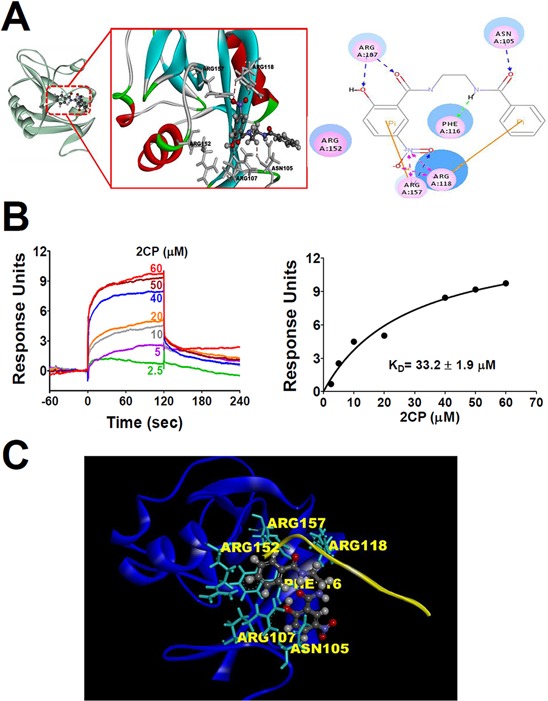
Podoplanin (PDPN) enhances tumor metastases by eliciting tumor cell-induced platelet aggregation (TCIPA) through activation of platelet C-type lectin-like receptor 2 (CLEC-2). A novel and non-cytotoxic 5-nitrobenzoate compound 2CP was synthesized that specifically inhibited the PDPN/CLEC-2 interaction and TCIPA with no effect on platelet aggregation stimulated by other platelet agonists. 2CP possessed anti-cancer metastatic activity in vivo and augmented the therapeutic efficacy of cisplatin in the experimental animal model without causing a bleeding risk. Analysis of the molecular action of 2CP further revealed that Akt1/PDK1 and PKCμ were two alternative CLEC-2 signaling pathways mediating PDPN-induced platelet activation. 2CP directly bound to CLEC-2 and, by competing with the same binding pocket of PDPN in CLEC-2, inhibited PDPN-mediated platelet activation. This study provides evidence that 2CP is the first defined platelet antagonist with CLEC-2 binding activity. The augmentation in the therapeutic efficacy of cisplatin by 2CP suggests that a combination of a chemotherapeutic agent and a drug with anti-TCIPA activity such as 2CP may prove clinically effective.

Keywords: TCIPA; platelet aggregation; podoplanin; tumor metastasis.


Conflict of interest statement

CONFLICTS OF INTEREST

The authors declare no conflict of interest.

Figures

Figure 1
Figure 1. Selective inhibition of PDPN-induced platelet aggregation by 2CP
A. Chemical structure of BMNS-related derivatives. B. Washed platelets were pre-incubated with the vehicle control DMSO or the indicated compounds (20 μM) at 37°C for 3 min and were subsequently stimulated by PDPN (8 μg/ml), thrombin (0.1 U/ml), collagen (2 μg/ml), ADP (20 μM) and U46619 (2 μM), respectively. Representative traces of platelet aggregation are shown. C. Washed platelets (1 × 10⁹/ml) were pre-incubated with the vehicle control DMSO or 2CP (20 μM) at 37°C for 3 min and were subsequently stimulated by the indicated CLEC-2 agonists (rhodocytin: 2 μg/ml; PDPN: 8 μg/ml). Platelet aggregation was recorded by a platelet aggregometer and representative traces of platelet aggregation for a total of at least four independent experiments are shown. Arrows indicate the point of agonist added.
Figure 2
Figure 2. 2CP inhibits PDPN-mediated TCIPA
A. The expression of PDPN proteins in the indicated cell lines was determined by Western blotting using the anti-PDPN antibody (inserted panel). The expression of β-actin was used for the control of equal protein loading. The cells (1.5 × 10⁶) from the indicated cell lines were added to the human washed platelet suspension (1 × 10⁹/ml) to stimulate platelet aggregation. Tumor cell-induced platelet aggregation was measured and recorded by using an aggregometer. Representative traces of platelet aggregation are shown. B. Calcein-AM green-labeled platelets (1 × 10⁹/ml, green) were incubated with the calcein-AM orange/red-labeled cells (1.5 × 10⁶, red) in an aggregometer. The reaction mixtures were then placed on a glass slide for fluorescence microscopy analysis. Representative fluorescent images are shown to demonstrate the interaction between tumor cells and platelets. Scale bar = 20 μm. C. The expression of PDPN protein in the indicated cell lines was determined by Western blotting using the anti-PDPN antibody (left panel). The expression of β-actin was used for the control of equal protein loading. The platelet aggregation-inducing activities of these sublines were evaluated by TCIPA assays. Representative traces of platelet aggregation are shown (right panel). Arrows indicate the point of cells being added. D. The cells from the indicated cell lines were added into the washed platelets with or without pre-incubation with 2CP (20 μM). Representative traces of platelet aggregation (left panel) and the turbidity of the reactions (center panel) are shown. The time to reach 50% of the maximal aggregation was defined as the aggregation time that is shown as Box with whiskers (Min to Max) plot (right panel). The value is set to 1000 sec when no platelet aggregation was observed. **P < 0.01 when compared with the vehicle treatment. E–F. Platelets and C6/Lung cells were treated with the indicated concentrations of 2CP and the LDH and caspase 3/7 activities were measured. The data represent the mean ± S.E of three to six independent experiments.
Figure 3
Figure 3. 2CP inhibits platelet aggregation induced by MG-63 and HOS osteosarcoma cells
PDPN expression in the MG-63 and HOS osteosarcoma cells was determined by Western blot (top panel) and flow cytometry (middle panel) analyses. For TCIPA assays, the MG-63 (2 × 10⁶) or HOS (1.5 × 10⁶) cells were added into the washed platelets (1 × 10⁹/ml) with or without pretreatment of 2CP (20 μM). Platelet aggregation was recorded by an aggregometer for 20 min (bottom panel).
Figure 4
Figure 4. Effects of 2CP on tail bleeding time and mouse pulmonary metastasis
A. The mice were intravenously injected with the control vehicle DMSO, 2CP (3.5 mg/kg), heparin (2 mg/kg) or LMWH (2 mg/kg) followed by measurement of the mouse tail bleeding time. The bleeding time was plotted and expressed as the mean ± S.E. A bleeding time longer than 360 sec was set as 360 sec. B. Timeline for the experimental protocols of the mouse pulmonary metastases model. The administration schedule and the therapeutic efficacy for 2CP and CDDP (2.5 mg/kg) were analyzed at the indicated time points. C–E. Representative bioluminescence images for tumor growth were shown (panel C, left) and quantified (panel C, right). Representative images of lung sections with metastatic foci (Hematoxylin and Eosin stain) were analyzed and quantified using Zeiss Axiovision software. Arrows point out the metastatic foci. (100 X magnification, scale bar = 100 μm). The corresponding metastatic area was expressed as the percentage of the whole lung region (panel D). The body weight was recorded and the percentage of body weight loss at day 21 after tumor inoculation was calculated. Data represent the mean ± S.E. from three to five independent experiments (panel E). *P < 0.05 and **P < 0.01 when compared with the control treatment. n.s., no significance.
Figure 5
Figure 5. Combination of 2CP with CDDP prolongs the survival time of the experimental animals
The mice were intravenously injected with the C6/Lung cells (1.75 × 10⁵) followed by the treatment with 2CP (n = 21), CDDP (2.5 mg/kg, n = 22), 2CP + CDDP (n = 23), or vehicle control (n = 21) as described in the Materials and Methods. The survival of the animals was recorded and the data were analyzed using the Kaplan-Meier survival curve and log rank test.
Figure 6
Figure 6. 2CP selectively inhibits PDPN- but not rhodocytin-induced platelet signaling
A–B. Washed platelets (1 × 10⁹/ml) were pre-incubated with or without 2CP (20 μM) at 37°C for 3 min, and then stimulated with PDPN (8 μg/ml) or rhodocytin (2 μg/ml). Whole cell lysates were prepared from the agonist-stimulated platelets and fractionated by SDS-PAGE. The protein phosphorylations were detected using the antibodies against phosphotyrosine (4G10) or the phospho-specific antibodies for the indicated proteins. The signals and relative phosphorylation levels of the indicated proteins were measured and quantified using the Image J software (NIH). The data represent the mean ± S.E. of four to eight independent experiments. **P < 0.01 when compared with the control treatment.
Figure 7
Figure 7. Molecular docking and SPR analyses reveals the interaction of 2CP with CLEC-2
A. Molecular docking modeling of 2CP with monomeric CLEC-2 was performed using the Discovery Studio program (Accelrys, San Diego, CA). 2CP is shown as a ball and stick model with gray carbons. Key residues of CLEC-2 are shown as sticks with gray carbons (left) or pink circles (right). Hydrogen bond interactions are shown as dotted red lines (left) or blue/pink lines. B. Different concentrations of 2CP were injected over the surfaces coupled with CLEC-2, producing a concentration-dependent signal. Sensorgrams from typical equilibrium-based binding experiments after subtraction of the background response from a control surface are shown in the left panel. Plot of the equilibrium binding response from the sensorgrams as a function of 2CP concentration is shown in the right panel. The curve is best fit to the experimental data with a calculated binding affinity of 33.2 ± 1.9 μM. Results are representative of four independent experiments. C. Podoplanin and 2CP share an overlapping binding site present in CLEC-2. The illustration was generated by superimposing the images of the crystal structure of CLEC-2 (blue)-PDPN (yellow) binding obtained from the PDB database (ID = 3WSR) and the molecular docking modeling of 2CP (ball and stick model with gray carbons) with monomeric CLEC-2. The key amino acids (Asn 105, Arg107, Phe116, Arg118, and Arg157) involved in the binding of 2CP are indicated (gray dashed lines represent hydrogen bonds). The model shows an overlying PDPN and 2CP-binding pocket in CLEC-2.

Similar articles

Cited by

References

    1. Gupta GP, Massague J. Platelets and metastasis revisited: a novel fatty link. J Clin Invest. 2004;114:1691–1693. - PMC - PubMed
    1. Stenger D, Dutting S, Nieswandt B. Mechanistic explanation for platelet contribution to cancer metastasis. Thromb Res. 2014;133:S149–157. - PubMed
    1. Jurasz P, Stewart MW, Radomski A, Khadour F, Duszyk M, Radomski MW. Role of von Willebrand factor in tumour cell-induced platelet aggregation: differential regulation by NO and prostacyclin. Br J Pharmacol. 2001;134:1104–1112. - PMC - PubMed
    1. Jurasz P, Alonso-Escolano D, Radomski MW. Platelet-cancer interactions: mechanisms and pharmacology of tumour cell-induced platelet aggregation. Br J Pharmacol. 2004;143:819–826. - PMC - PubMed
    1. Erpenbeck L, Schon MP. Deadly allies: the fatal interplay between platelets and metastasizing cancer cells. Blood. 2010;115:3427–3436. - PMC - PubMed

Publication types

MeSH terms