Functionally conserved enhancers with divergent sequences in distant vertebrates
- PMID: 26519295
- PMCID: PMC4628251
- DOI: 10.1186/s12864-015-2070-7
Functionally conserved enhancers with divergent sequences in distant vertebrates
Abstract
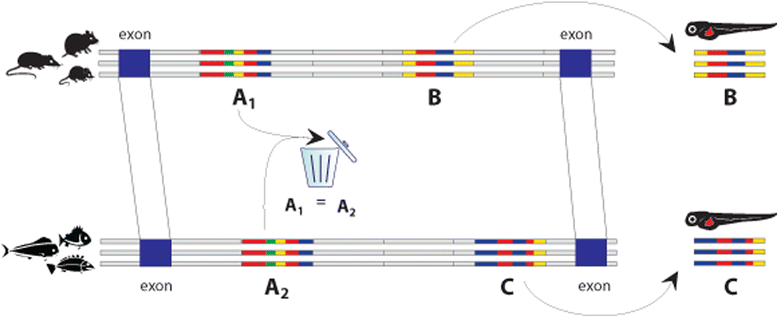
Background: To examine the contributions of sequence and function conservation in the evolution of enhancers, we systematically identified enhancers whose sequences are not conserved among distant groups of vertebrate species, but have homologous function and are likely to be derived from a common ancestral sequence. Our approach combined comparative genomics and epigenomics to identify potential enhancer sequences in the genomes of three groups of distantly related vertebrate species.
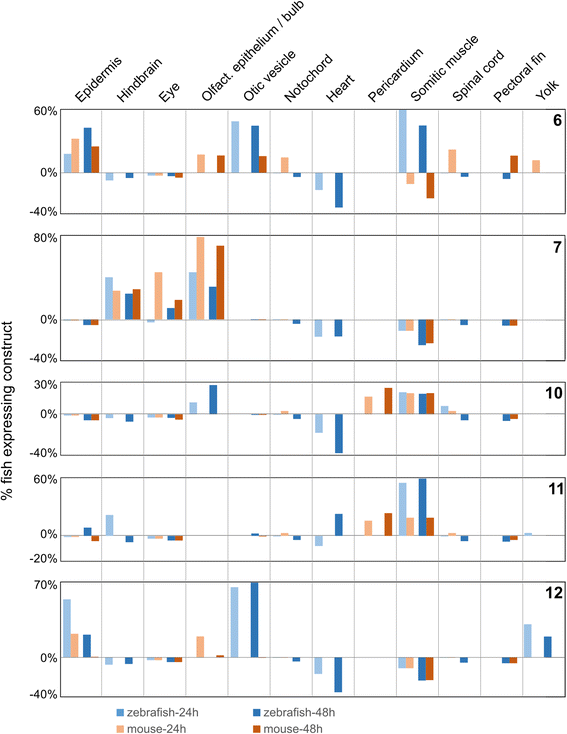
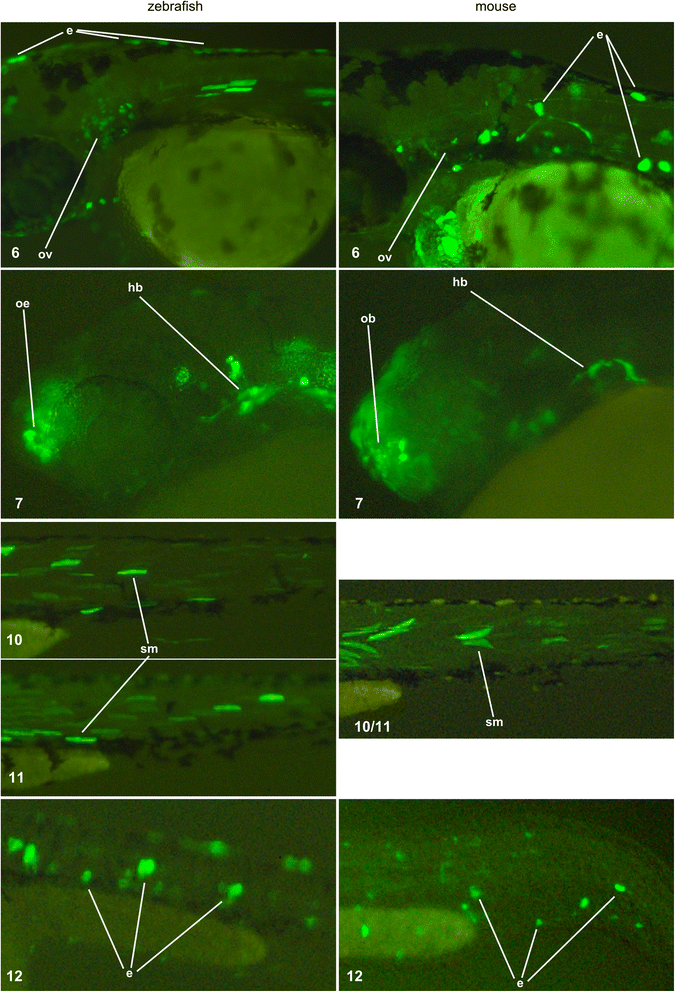
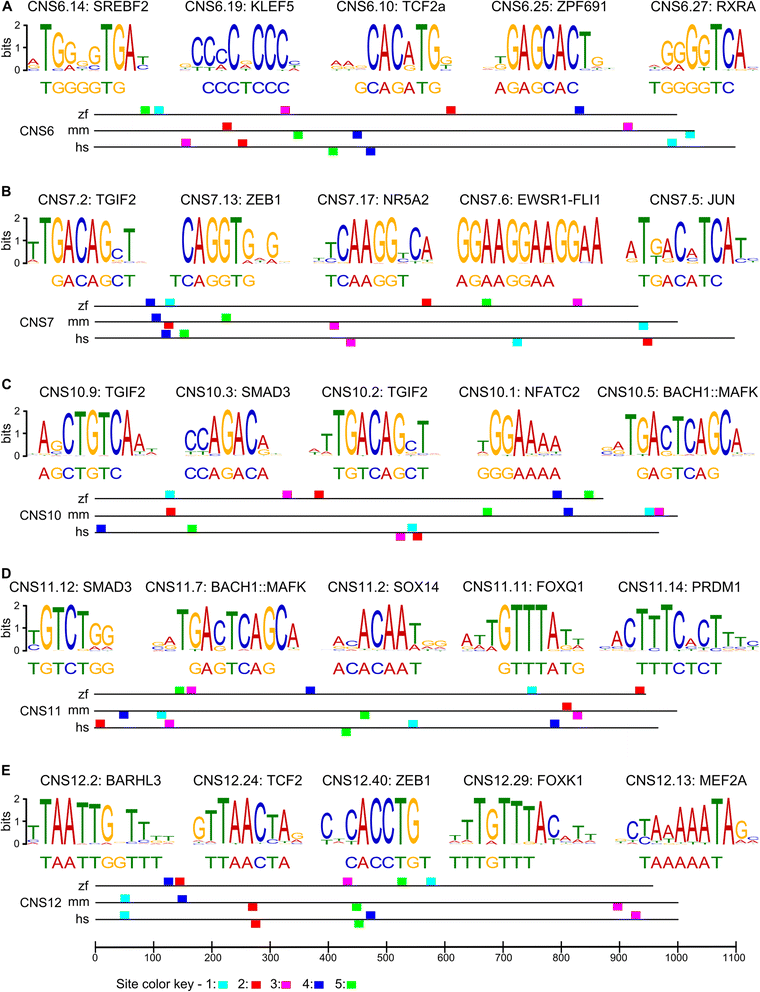
Results: We searched for sequences that were conserved within groups of closely related species but not between groups of more distant species, and were associated with an epigenetic mark of enhancer activity. To facilitate inferring orthology between non-conserved sequences, we limited our search to introns whose orthology could be unambiguously established by mapping the bracketing exons. We show that a subset of these non-conserved but syntenic sequences from the mouse and zebrafish genomes have homologous functions in a zebrafish transgenic enhancer assay. The conserved expression patterns driven by these enhancers are probably associated with short transcription factor-binding motifs present in the divergent sequences.
Conclusions: We have identified numerous potential enhancers with divergent sequences but a conserved function. These results indicate that selection on function, rather than sequence, may be a common mode of enhancer evolution; evidence for selection at the sequence level is not a necessary criterion to define a gene regulatory element.
Figures


Similar articles
-
Enhancer turnover and conserved regulatory function in vertebrate evolution.Philos Trans R Soc Lond B Biol Sci. 2013 Nov 11;368(1632):20130027. doi: 10.1098/rstb.2013.0027. Print 2013 Dec 19. Philos Trans R Soc Lond B Biol Sci. 2013. PMID: 24218639 Free PMC article.
-
Comparative functional genomics revealed conservation and diversification of three enhancers of the isl1 gene for motor and sensory neuron-specific expression.Dev Biol. 2005 Feb 15;278(2):587-606. doi: 10.1016/j.ydbio.2004.11.031. Dev Biol. 2005. PMID: 15680372
-
Deeply conserved chordate noncoding sequences preserve genome synteny but do not drive gene duplicate retention.Genome Res. 2009 Nov;19(11):2036-51. doi: 10.1101/gr.093237.109. Epub 2009 Aug 24. Genome Res. 2009. PMID: 19704032 Free PMC article.
-
The evolutionary origin of developmental enhancers in vertebrates: Insights from non-model species.Dev Growth Differ. 2020 Jun;62(5):326-333. doi: 10.1111/dgd.12662. Epub 2020 Apr 12. Dev Growth Differ. 2020. PMID: 32181886 Review.
-
Tuning in to the signals: noncoding sequence conservation in vertebrate genomes.Trends Genet. 2008 Jul;24(7):344-52. doi: 10.1016/j.tig.2008.04.005. Epub 2008 May 29. Trends Genet. 2008. PMID: 18514361 Review.
Cited by
-
Phylogenetic Modeling of Regulatory Element Turnover Based on Epigenomic Data.Mol Biol Evol. 2020 Jul 1;37(7):2137-2152. doi: 10.1093/molbev/msaa073. Mol Biol Evol. 2020. PMID: 32176292 Free PMC article.
-
Relating enhancer genetic variation across mammals to complex phenotypes using machine learning.Science. 2023 Apr 28;380(6643):eabm7993. doi: 10.1126/science.abm7993. Epub 2023 Apr 28. Science. 2023. PMID: 37104615 Free PMC article.
-
Transposable elements are the primary source of novelty in primate gene regulation.Genome Res. 2017 Oct;27(10):1623-1633. doi: 10.1101/gr.218149.116. Epub 2017 Aug 30. Genome Res. 2017. PMID: 28855262 Free PMC article.
-
ATAC-Seq for Assaying Chromatin Accessibility Protocol Using Echinoderm Embryos.Methods Mol Biol. 2021;2219:253-265. doi: 10.1007/978-1-0716-0974-3_16. Methods Mol Biol. 2021. PMID: 33074546
-
The Role of Chromatin Accessibility in cis-Regulatory Evolution.Genome Biol Evol. 2019 Jul 1;11(7):1813-1828. doi: 10.1093/gbe/evz103. Genome Biol Evol. 2019. PMID: 31114856 Free PMC article.
References
Publication types
MeSH terms
Substances
Grants and funding
- R01HG005058/HG/NHGRI NIH HHS/United States
- 1R01NS079231/NS/NINDS NIH HHS/United States
- R01 HD059862/HD/NICHD NIH HHS/United States
- GM61390/GM/NIGMS NIH HHS/United States
- 1R01HG006768/HG/NHGRI NIH HHS/United States
- 1R01DK090382/DK/NIDDK NIH HHS/United States
- R01 NS079231/NS/NINDS NIH HHS/United States
- U01 GM061390/GM/NIGMS NIH HHS/United States
- R01 HG006768/HG/NHGRI NIH HHS/United States
- U19 GM061390/GM/NIGMS NIH HHS/United States
- R01HD059862/HD/NICHD NIH HHS/United States
- R01 HL091495/HL/NHLBI NIH HHS/United States
- R01 DK090382/DK/NIDDK NIH HHS/United States
- R01 HG005058/HG/NHGRI NIH HHS/United States
LinkOut - more resources
Full Text Sources
Other Literature Sources

