

Orientation dependence of microcirculation-induced diffusion signal in anisotropic tissues
- PMID: 26511215
- PMCID: PMC5648001
- DOI: 10.1002/mrm.25980
Orientation dependence of microcirculation-induced diffusion signal in anisotropic tissues
Abstract
Purpose: To seek a better understanding of the effect of organized capillary flow on the MR diffusion-weighted signal.
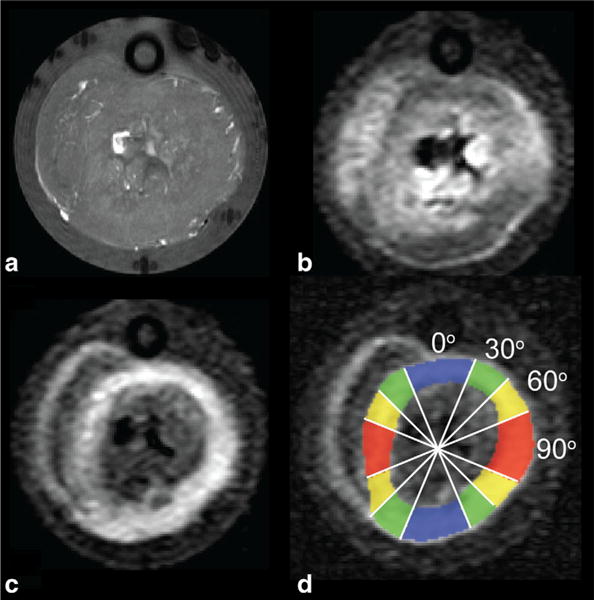
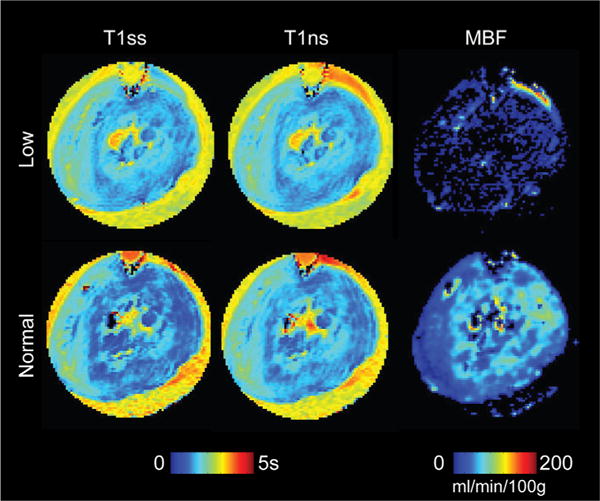
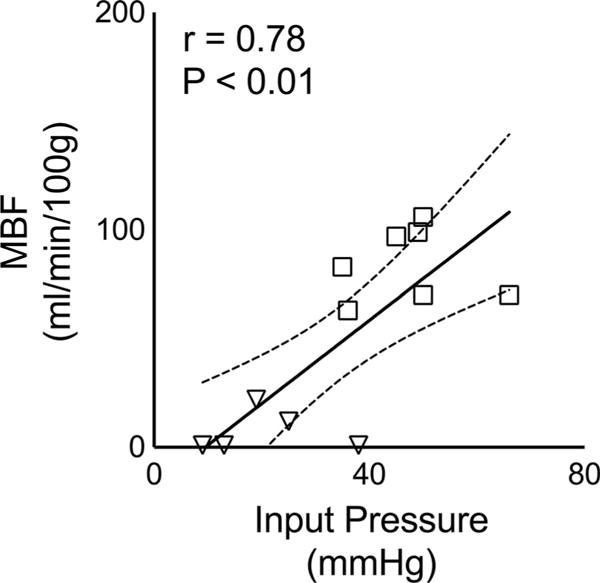
Methods: A theoretical framework was proposed to describe the diffusion-weighted MR signal, which was then validated both numerically using a realistic model of capillary network and experimentally in an animal model of isolated perfused heart preparation with myocardial blood flow verified by means of direct arterial spin labeling measurements.
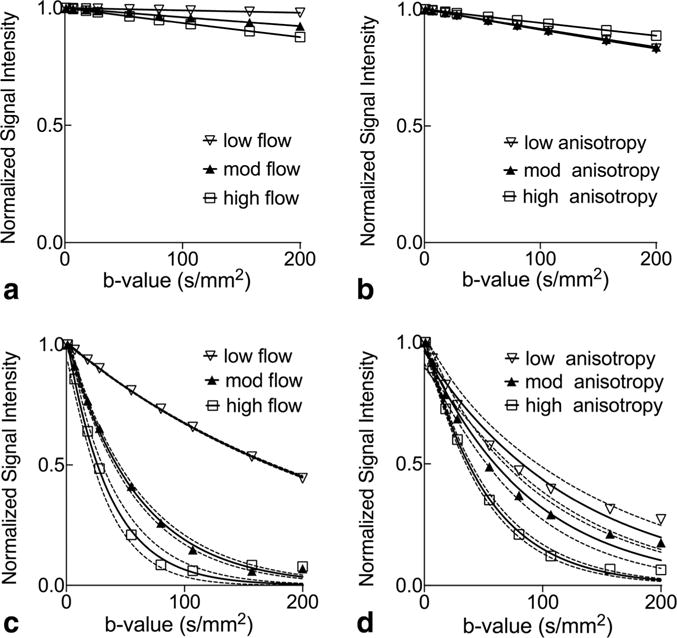
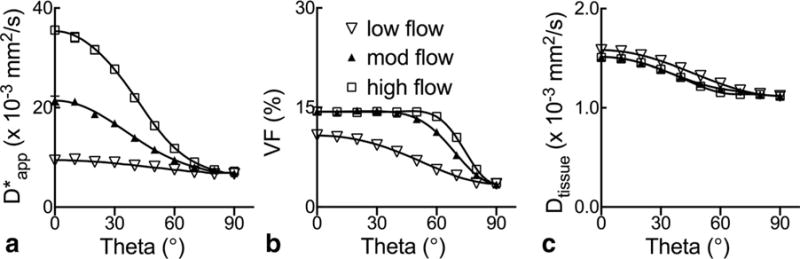
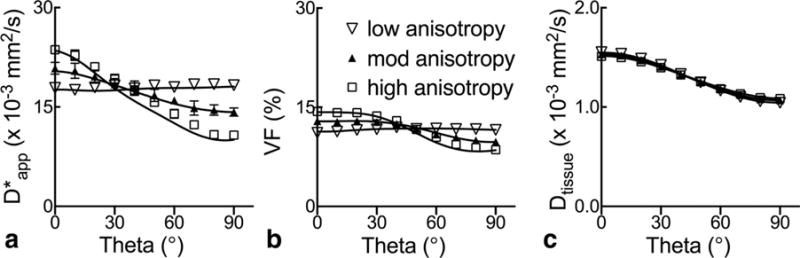
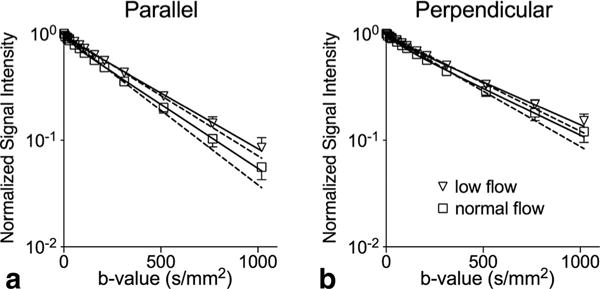
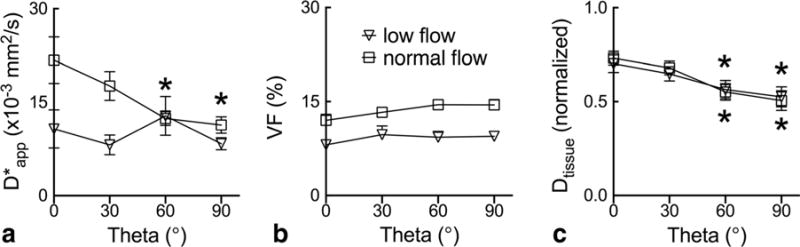
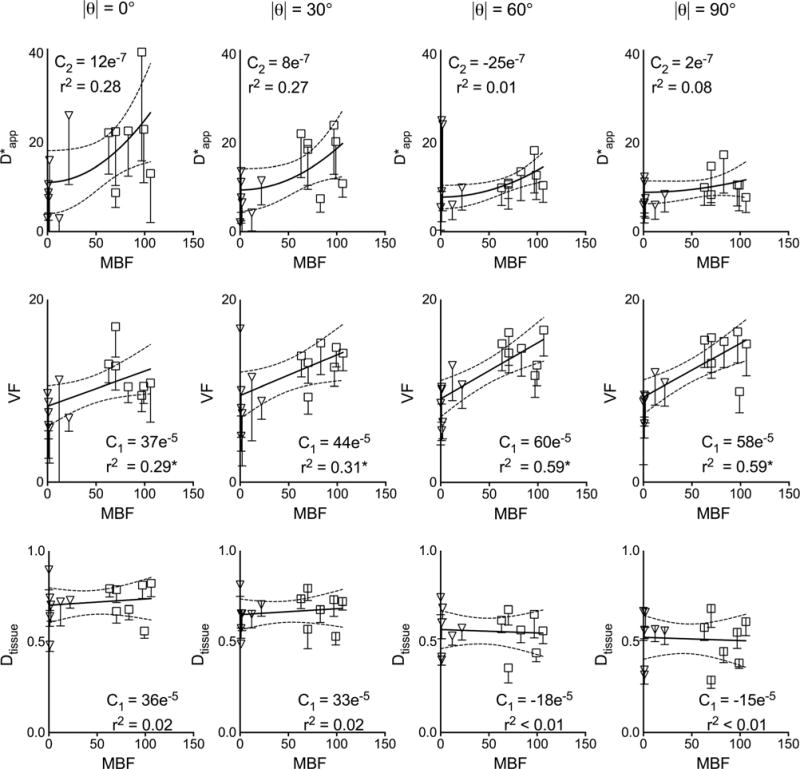
Results: Microcirculation in organized tissues gave rise to an MR signal that could be described as a combination of the bi-exponential behavior of conventional intravoxel incoherent motion (IVIM) theory and diffusion tensor imaging (DTI) -like anisotropy of the vascular signal, with the flow-related pseudo diffusivity represented as the linear algebraic product between the encoding directional unit vector and an appropriate tensor entity. Very good agreement between theoretical predictions and both numerical and experimental observations were found.
Conclusion: These findings suggest that the DTI formalism of anisotropic spin motion can be incorporated into the classical IVIM theory to describe the MR signal arising from diffusion and microcirculation in organized tissues. Magn Reson Med 76:1252-1262, 2016. © 2015 Wiley Periodicals, Inc.
Keywords: IVIM; anisotropic blood flow; apparent diffusion coefficient; diffusion-weighted MRI; organized capillary flow; perfusion fraction.
© 2015 Wiley Periodicals, Inc.
Figures
Similar articles
-
Simultaneous magnetic resonance diffusion and pseudo-diffusion tensor imaging.Magn Reson Med. 2018 Apr;79(4):2367-2378. doi: 10.1002/mrm.26840. Epub 2017 Jul 16. Magn Reson Med. 2018. PMID: 28714249 Free PMC article.
-
An intravoxel oriented flow model for diffusion-weighted imaging of the kidney.NMR Biomed. 2016 Oct;29(10):1403-13. doi: 10.1002/nbm.3584. Epub 2016 Aug 4. NMR Biomed. 2016. PMID: 27488570
-
Assessment of Liver Perfusion by IntraVoxel Incoherent Motion (IVIM) Magnetic Resonance-Diffusion-Weighted Imaging: Correlation With Phase-Contrast Portal Venous Flow Measurements.J Comput Assist Tomogr. 2015 May-Jun;39(3):365-72. doi: 10.1097/RCT.0000000000000220. J Comput Assist Tomogr. 2015. PMID: 25700227
-
[The clinical application of diffusion weighted magnetic resonance imaging to acute cerebrovascular disorders].No To Shinkei. 1998 Sep;50(9):787-95. No To Shinkei. 1998. PMID: 9789301 Review. Japanese.
-
Differentiation of diffusion coefficients to distinguish malignant and benign tumor.J Xray Sci Technol. 2010;18(3):235-49. doi: 10.3233/XST-2010-0257. J Xray Sci Technol. 2010. PMID: 20714083 Review.
Cited by
-
Simultaneous Quantification of Anisotropic Microcirculation and Microstructure in Peripheral Nerve.J Clin Med. 2022 May 27;11(11):3036. doi: 10.3390/jcm11113036. J Clin Med. 2022. PMID: 35683424 Free PMC article.
-
Placenta microstructure and microcirculation imaging with diffusion MRI.Magn Reson Med. 2018 Aug;80(2):756-766. doi: 10.1002/mrm.27036. Epub 2017 Dec 11. Magn Reson Med. 2018. PMID: 29230859 Free PMC article.
-
Intravoxel Incoherent Motion Magnetic Resonance Imaging with Integrated Slice-specific Shimming for old myocardial infarction: A Pilot Study.Sci Rep. 2019 Dec 24;9(1):19766. doi: 10.1038/s41598-019-56489-6. Sci Rep. 2019. PMID: 31875029 Free PMC article. Clinical Trial.
-
Evaluation of non-Gaussian diffusion in cardiac MRI.Magn Reson Med. 2017 Sep;78(3):1174-1186. doi: 10.1002/mrm.26466. Epub 2016 Sep 26. Magn Reson Med. 2017. PMID: 27670633 Free PMC article.
-
Diffusion tensor imaging and histology of developing hearts.NMR Biomed. 2016 Oct;29(10):1338-49. doi: 10.1002/nbm.3576. Epub 2016 Aug 3. NMR Biomed. 2016. PMID: 27485033 Free PMC article.
References
-
- Stejskal EO, Tanner JE. Spin diffusion measurements: spin echoes in the presence of a time-dependent field gradient. J Chem Phys. 1965;42:288.
-
- Stejskal EO. Use of spin echoes in a pulsed magnetic-field gradient to study anisotropic, restricted diffusion and flow. J Chem Phys. 1965;43
-
- Moseley ME, Cohen Y, Mintorovitch J, Chileuitt L, Shimizu H, Kucharczyk J, Wendland MF, Weinstein PR. Early detection of regional cerebral ischemia in cats: comparison of diffusion- and T2-weighted MRI and spectroscopy. Magn Reson Med. 1990;14:330–3346. - PubMed
-
- Le Bihan D, Breton E, Lallemand D, Grenier P, Cabani E, Jeantet L. MR imaging of intravoxel incoherent motions: application to diffusion and perfusion in neurologic disorders. Radiology. 1986;161:401–407. - PubMed
Publication types
MeSH terms
Grants and funding
LinkOut - more resources
Full Text Sources
Other Literature Sources
