

Epidemiologic, Virologic, and Host Genetic Factors of Norovirus Outbreaks in Long-term Care Facilities
- PMID: 26508509
- PMCID: PMC5921905
- DOI: 10.1093/cid/civ747
Epidemiologic, Virologic, and Host Genetic Factors of Norovirus Outbreaks in Long-term Care Facilities
Abstract
Background: In the Unites States, long-term care facilities (LTCFs) are the most common setting for norovirus outbreaks. These outbreaks provide a unique opportunity to better characterize the viral and host characteristics of norovirus disease.
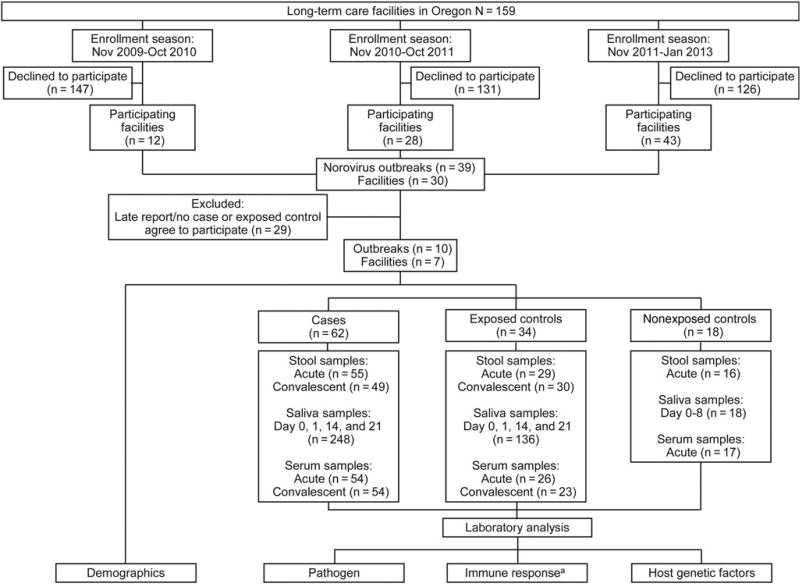
Methods: We enrolled 43 LTCFs prospectively to study the epidemiology, virology, and genetic host factors of naturally occurring norovirus outbreaks. Acute and convalescent stool, serum, and saliva samples from cases, exposed and nonexposed controls were collected. Norovirus infection was confirmed using quantitative polymerase chain reaction testing of stool samples or 4-fold increase in serum antibody titers. The presence of histo-blood group antigens (secretor, ABO, and Lewis type) was determined in saliva.
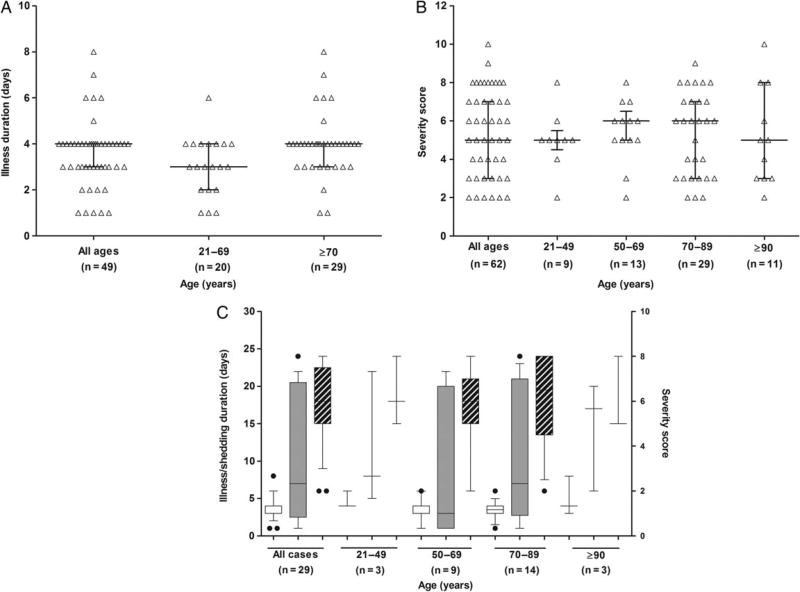
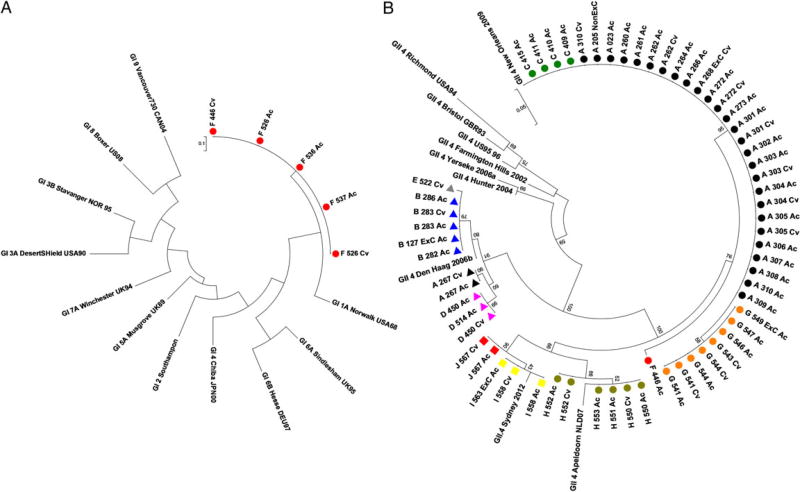
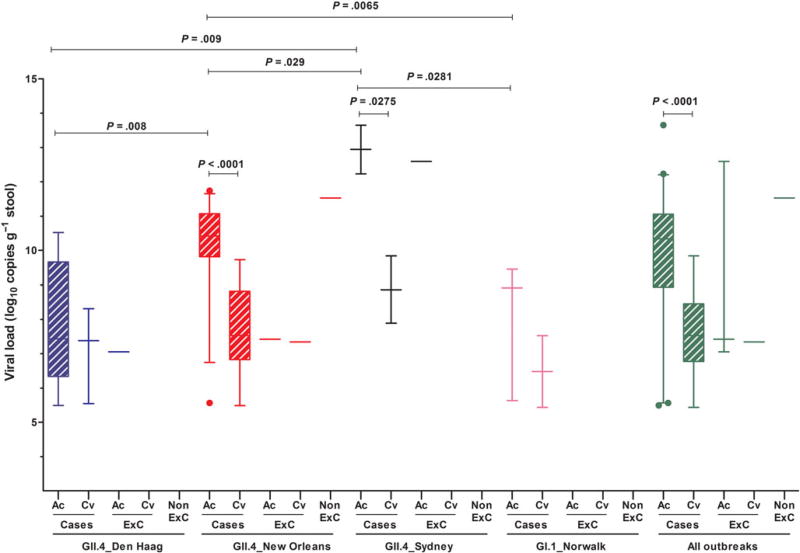
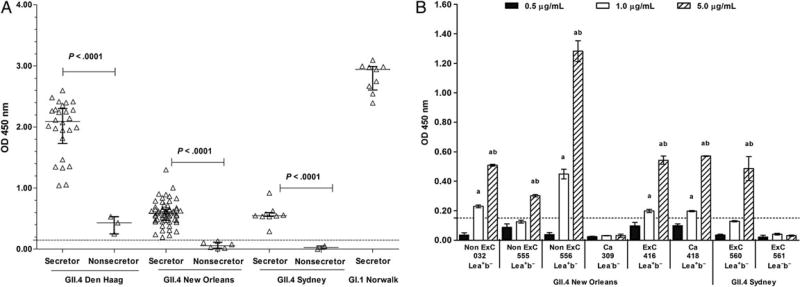
Results: Sixty-two cases, 34 exposed controls, and 18 nonexposed controls from 10 norovirus outbreaks were enrolled. Forty-six percent of acute, 27% of convalescent case, and 11% of control stool samples tested norovirus positive. Outbreak genotypes were GII.4 (Den Haag, n = 3; New Orleans, n = 4; and Sydney, n = 2) and GI.1 (n = 1). Viral load in GII.4 Sydney outbreaks was significantly higher than in outbreaks caused by other genotypes; cases and controls shed similar amounts of virus. Forty-seven percent of cases shed virus for ≥ 21 days. Symptomatic infections with GII.4 Den Haag and GII.4 New Orleans were detected among nonsecretor individuals.
Conclusions: Almost half of all symptomatic individuals shed virus for at least 21 days. Viral load was highest in GII.4 viruses that most recently emerged; these viruses also infect the nonsecretor population. These findings will help to guide development of targeted prevention and control measures in the elderly.
Keywords: long-term care facilities; norovirus; secretor status; shedding.
Published by Oxford University Press for the Infectious Diseases Society of America 2015. This work is written by (a) US Government employee(s) and is in the public domain in the US.
Conflict of interest statement
Figures

Similar articles
-
Epidemiology and molecular characteristics of norovirus GII.4 Sydney outbreaks in Taiwan, January 2012-December 2013.J Med Virol. 2015 Sep;87(9):1462-70. doi: 10.1002/jmv.24208. Epub 2015 May 6. J Med Virol. 2015. PMID: 25946552 Free PMC article.
-
Outbreak studies of a GII-3 and a GII-4 norovirus revealed an association between HBGA phenotypes and viral infection.J Med Virol. 2008 Jul;80(7):1296-301. doi: 10.1002/jmv.21200. J Med Virol. 2008. PMID: 18461617
-
Molecular and clinical epidemiology of norovirus outbreaks in Spain during the emergence of GII.4 2012 variant.J Clin Virol. 2014 Jun;60(2):96-104. doi: 10.1016/j.jcv.2014.03.013. Epub 2014 Mar 27. J Clin Virol. 2014. PMID: 24746342
-
Norovirus Infections in Long-Term Care Facilities.J Am Geriatr Soc. 2016 May;64(5):1097-103. doi: 10.1111/jgs.14085. J Am Geriatr Soc. 2016. PMID: 27225361 Review.
-
Genetic Susceptibility to Human Norovirus Infection: An Update.Viruses. 2019 Mar 6;11(3):226. doi: 10.3390/v11030226. Viruses. 2019. PMID: 30845670 Free PMC article. Review.
Cited by
-
Norovirus disease among older adults.Ther Adv Infect Dis. 2022 Nov 14;9:20499361221136760. doi: 10.1177/20499361221136760. eCollection 2022 Jan-Dec. Ther Adv Infect Dis. 2022. PMID: 36406815 Free PMC article. Review.
-
High Hand Contamination Rates During Norovirus Outbreaks in Long-Term Care Facilities.Infect Control Hosp Epidemiol. 2018 Feb;39(2):219-221. doi: 10.1017/ice.2017.274. Epub 2018 Jan 14. Infect Control Hosp Epidemiol. 2018. PMID: 29331156 Free PMC article.
-
Norovirus Disease in Older Adults Living in Long-Term Care Facilities: Strategies for Management.Curr Geriatr Rep. 2017;6(1):26-33. doi: 10.1007/s13670-017-0195-z. Epub 2017 Feb 24. Curr Geriatr Rep. 2017. PMID: 29204334 Free PMC article.
-
Norovirus outbreaks in long-term care facilities in Catalonia from 2017 to 2018.Sci Rep. 2021 Dec 1;11(1):23218. doi: 10.1038/s41598-021-02348-2. Sci Rep. 2021. PMID: 34853333 Free PMC article.
-
Noroviruses-The State of the Art, Nearly Fifty Years after Their Initial Discovery.Viruses. 2021 Aug 4;13(8):1541. doi: 10.3390/v13081541. Viruses. 2021. PMID: 34452406 Free PMC article. Review.
References
-
- Rosenthal NA, Lee LE, Vermeulen BA, et al. Epidemiological and genetic characteristics of norovirus outbreaks in long-term care facilities, 2003–2006. Epidemiol Infect. 2011;139:286–94. - PubMed
-
- Trivedi TK, DeSalvo T, Lee L, et al. Hospitalizations and mortality associated with norovirus outbreaks in nursing homes, 2009–2010. JAMA. 2012;308:1668–75. - PubMed
Publication types
MeSH terms
Substances
Grants and funding
LinkOut - more resources
Full Text Sources
Other Literature Sources
Medical
Research Materials
