

Review
doi: 10.1007/s00018-015-2072-2.
Epub 2015 Oct 26.
Circadian mRNA expression: insights from modeling and transcriptomics
Affiliations
- PMID: 26496725
- PMCID: PMC11108398
- DOI: 10.1007/s00018-015-2072-2
Item in Clipboard
Review
Circadian mRNA expression: insights from modeling and transcriptomics
Cell Mol Life Sci.
2016 Feb.
Abstract
Circadian clocks synchronize organisms to the 24 h rhythms of the environment. These clocks persist under constant conditions, have their origin at the cellular level, and produce an output of rhythmic mRNA expression affecting thousands of transcripts in many mammalian cell types. Here, we review the charting of circadian output rhythms in mRNA expression, focusing on mammals. We emphasize the challenges in statistics, interpretation, and quantitative descriptions that such investigations have faced and continue to face, and outline remaining outstanding questions.
Keywords: Biostatistics; Circadian; Post-transcriptional regulation; Systems biology; mRNA expression.
Figures
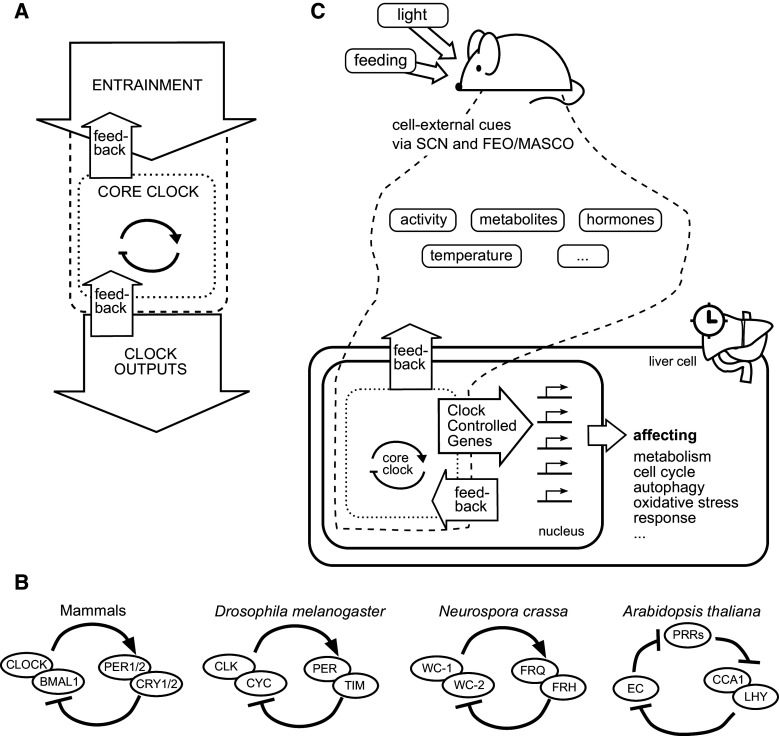
Overview of the circadian clock and its input and output pathways in the mouse. a Circadian clock (dotted) and its input (dashed) and output. This model could represent an animal, with inputs such as light cues and outputs such as rhythms in arousal. The model could also represent the cellular circadian clock as expanded upon in panel
c. b The core clock has similar designs in animals, plants, and fungi. In mammals, TF heterodimer CLOCK/BMAL1 activates transcription of transcriptional repressors PER1/2 and CRY1/2, which target CLOCK/BMAL1-mediated transcription. The Drosophila core clock contains TF heterodimer CLK/CYC (homologs to CLOCK and BMAL1, respectively) that activates transcription of repressors PER (homologous to mammalian PERs) and TIM [5]. The core clock of Neurospora crassa involves transcriptional activators WC1 and WC2 together with the repressor FRQ and helper protein FRH. WC1 might be a homolog of BMAL1 [27]. Finally, the principal negative feedback loop of the Arabidopsis thaliana core clock might be constituted by three transcriptional repressors inhibiting each other in a cyclical layout: a so-called repressilator [29]. Here, PRRs is a group of three proteins (PRR5, PRR7, PRR9); EC stands for evening complex and consists of the proteins ELF3, ELF4, and LUX. c The cellular circadian clock is depicted from the point of view of a hepatocyte, in a specific version of the model in panel
a. The circadian clock (dotted lines) becomes entrained via cues (dashed lines) originating primarily from the SCN, but also from two other ~24 h oscillators (FEO, food-entrainable oscillator; MASCO, methamphetamine sensitive circadian oscillator) [37]. The circadian clock and the cues together orchestrate circadian rhythms in the expression of hundreds of genes. Not shown are the probably great number of feedback pathways from peripheral tissues to the SCN [37]
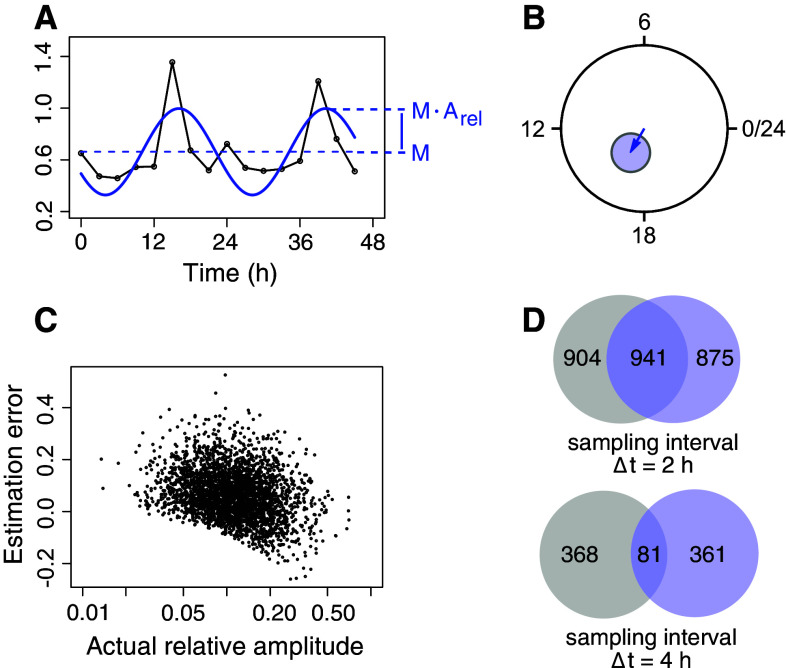
Quantification of circadian mRNA expression. a An overview of measures used when quantifying circadian mRNA expression: M (mean or magnitude), and A (relative amplitude). The absolute amplitude is M × A. b Quantification results in phases and relative amplitudes that can be represented abstractly in a circadian phase plane. The angle then becomes the phase, and the length of the hand (or vector) becomes the relative amplitude. Uncertainties in estimates of amplitudes and phases are represented as 95 % confidence ellipses. c When the number of time points per time series is low, there is a positive bias in the amplitude estimation by the harmonic regression method. Synthetic time series were generated using amplitudes as sampled from harmonic regression estimates of all circadian time series in the mouse liver microarray data of [40]. Circadian time series had RAIN Benjamini–Hochberg adjusted p values smaller than 0.01, for microarray processing, see Table 1. Synthetic time series were generated as six time points sampled evenly at CT0–CT20. White noise was added multiplicatively to produce a coefficient of variation (standard deviation over mean) at each time point of 0.2. d When the number of samples is low, identical populations of rhythmic time series but with different random variability added, can appear to be very different in terms of which time series are rhythmic. Two identical populations of 3000 rhythmic time series were generated as above with the indicated sampling interval. Multiplicative Gaussian noise with a coefficient of variation of 0.2 was generated separately for the two populations. For each population, 7000 time series that were non-rhythmic (amplitude zero), but that had the same noise characteristics, were also generated. Using a Benjamini–Hochberg adjusted RAIN p value cutoff of 0.05 to decide if a time series is rhythmic or not resulted in the overlaps depicted

Illustration of factors exerting circadian regulation of transcription rates. TFs bind in a circadian fashion to promoter regions (or downstream of the TSS). Such TFs include CLOCK/BMAL1, PAR-bZIP TFs such as E4BP4, and REV-ERBs. Co-regulators, such as PER and CRY co-repressors, may modify the action of the TFs. TFs and co-regulators conspire to recruit various chromatin modifiers, including histone acetyl or methyl transferases, or histone deacetylases, in a circadian fashion. In turn, this leads to circadian fluctuations in the rate with which Polymerase II is recruited to the core promoter (the region immediately proximal to the TSS). Ultimately, this results in circadian rhythms in transcription rates
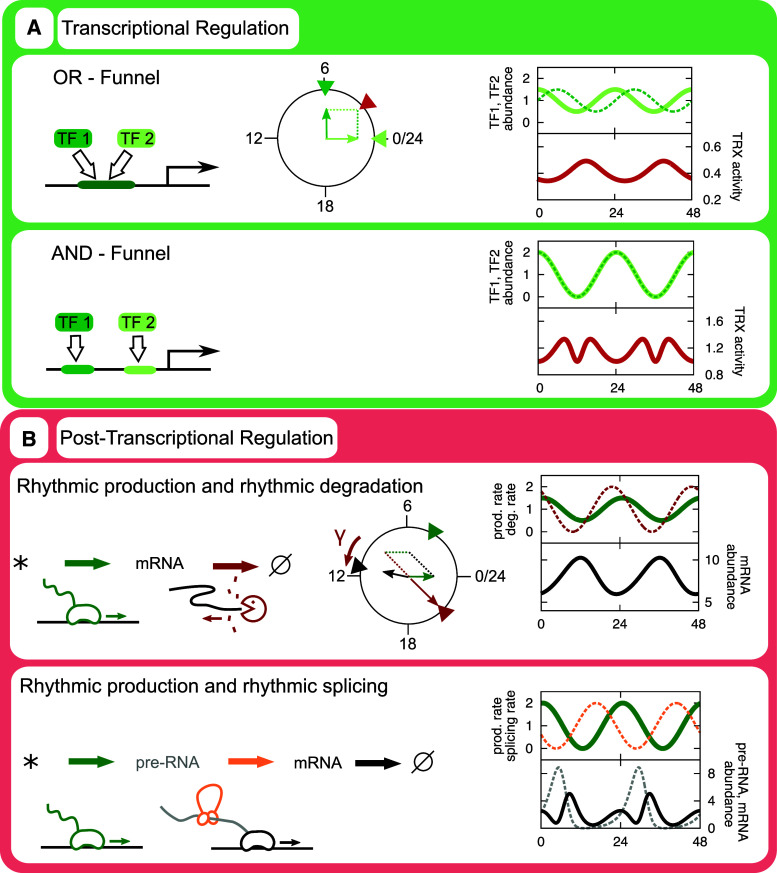
Combinatorial transcriptional control and effects of rhythmic decay rates. a The action of rhythmic abundances of TFs is additive if they compete for a binding site, multiplicative if they bind to separate sites. Quantitatively, these phenomena can be approximated as vector operations in the circadian phase plane. Here, two TFs, TF1 and TF2, are considered. Light green solid lines refer to the abundance of TF1, dotted dark green lines to TF2, which has a peak phase 6 h later than TF1. The combinatorial effects of the TFs are depicted as red lines. b Also the effect of rhythmic decay rates can be understood as a vector addition of transcriptional activity (green) and decay rate inverted 12 h (red). The resulting vector is adjusted by average decay rate (gamma), which is a good approximation for the phase of the transcript abundance (black). See Lück et al. [171] for details. Extending this model to incorporate splicing activity (orange, dotted) of pre-mRNA (gray, dotted) may result in 12 h rhythms in transcript abundance but not in pre-mRNA abundance. See accompanying Mathematica notebook for equations and solution methods (Supplemental file)
Similar articles
-
RNA-based regulation in the plant circadian clock.Trends Plant Sci. 2011 Oct;16(10):517-23. doi: 10.1016/j.tplants.2011.06.002. Epub 2011 Jul 23. Trends Plant Sci. 2011. PMID: 21782493 Review.
-
Critical role of deadenylation in regulating poly(A) rhythms and circadian gene expression.PLoS Comput Biol. 2020 Apr 27;16(4):e1007842. doi: 10.1371/journal.pcbi.1007842. eCollection 2020 Apr. PLoS Comput Biol. 2020. PMID: 32339166 Free PMC article.
-
Circadian genomics reveal a role for post-transcriptional regulation in mammals.Biochemistry. 2015 Jan 20;54(2):124-33. doi: 10.1021/bi500707c. Epub 2014 Dec 30. Biochemistry. 2015. PMID: 25303020 Free PMC article. Review.
-
Spotlight on post-transcriptional control in the circadian system.Cell Mol Life Sci. 2011 Jan;68(1):71-83. doi: 10.1007/s00018-010-0513-5. Epub 2010 Aug 30. Cell Mol Life Sci. 2011. PMID: 20803230 Free PMC article. Review.
-
Translating around the clock: Multi-level regulation of post-transcriptional processes by the circadian clock.Cell Signal. 2021 Apr;80:109904. doi: 10.1016/j.cellsig.2020.109904. Epub 2020 Dec 25. Cell Signal. 2021. PMID: 33370580 Free PMC article. Review.
Cited by
-
A conditional Smg6 mutant mouse model reveals circadian clock regulation through the nonsense-mediated mRNA decay pathway.Sci Adv. 2023 Jan 13;9(2):eade2828. doi: 10.1126/sciadv.ade2828. Epub 2023 Jan 13. Sci Adv. 2023. PMID: 36638184 Free PMC article.
-
Principles for circadian orchestration of metabolic pathways.Proc Natl Acad Sci U S A. 2017 Feb 14;114(7):1572-1577. doi: 10.1073/pnas.1613103114. Epub 2017 Feb 3. Proc Natl Acad Sci U S A. 2017. PMID: 28159888 Free PMC article.
-
The Making and Breaking of RNAs: Dynamics of Rhythmic RNA Expression in Mammals.J Biol Rhythms. 2020 Dec;35(6):519-529. doi: 10.1177/0748730420957498. Epub 2020 Sep 23. J Biol Rhythms. 2020. PMID: 32965157 Free PMC article. Review.
-
Circadian rhythms in septic shock patients.Ann Intensive Care. 2021 Apr 26;11(1):64. doi: 10.1186/s13613-021-00833-5. Ann Intensive Care. 2021. PMID: 33900485 Free PMC article.
-
First-passage time statistics of stochastic transcription process for time-dependent reaction rates.Eur Phys J E Soft Matter. 2019 Feb 25;42(2):24. doi: 10.1140/epje/i2019-11788-8. Eur Phys J E Soft Matter. 2019. PMID: 30793216
References
-
- Eskin A. Identification and physiology of circadian pacemakers. Introduction. Fed Proc. 1979;38:2570–2572. - PubMed
-
- Pittendrigh CS (1965) Biological clocks, the functions, ancient and modern, of biological oscillations. In: Sci. Sixties Proc. 1965 Cloudcroft Symp. Air Force Office of Scientific Research, Arlington, VA., pp 96–111
-
- Hamner KC, Finn JC, Sirohi GS, Hoshizaki T, Carpenter BH. The biological clock at the south pole. Nature. 1962;195:476–480. doi: 10.1038/195476a0. - DOI
Publication types
MeSH terms
Substances
LinkOut - more resources
Full Text Sources
