Review
. 2015 Aug 20;8(2):a020453.
doi: 10.1101/cshperspect.a020453.

Oligodendrocyte Development and Plasticity

Affiliations
Review

Oligodendrocyte Development and Plasticity

Dwight E Bergles et al. Cold Spring Harb Perspect Biol. .

Abstract

Oligodendrocyte precursor cells (OPCs) originate in the ventricular zones (VZs) of the brain and spinal cord and migrate throughout the developing central nervous system (CNS) before differentiating into myelinating oligodendrocytes (OLs). It is not known whether OPCs or OLs from different parts of the VZ are functionally distinct. OPCs persist in the postnatal CNS, where they continue to divide and generate myelinating OLs at a decreasing rate throughout adult life in rodents. Adult OPCs respond to injury or disease by accelerating their cell cycle and increasing production of OLs to replace lost myelin. They also form synapses with unmyelinated axons and respond to electrical activity in those axons by generating more OLs and myelin locally. This experience-dependent "adaptive" myelination is important in some forms of plasticity and learning, for example, motor learning. We review the control of OL lineage development, including OL population dynamics and adaptive myelination in the adult CNS.


Figures

Figure 1.
Figure 1.
Specification and proliferation of OPCs in the developing spinal cord. (A) Neural stem cells in the pMN domain of the embryonic spinal cord near the floor plate express Olig2 (magenta) and make MNs (marked by expression of transcription factor HB9) from ∼E9–E12 in mouse. (B) Starting on ∼E12.5, the pMN stem cells switch to making OPCs, which express Pdgfra (red). The Nkx2.2+ nuclei outside the VZ are mostly interneurons. Pdgfra+ OPCs start to express Nkx2.2 as they migrate away from the midline and up-regulate its expression as they differentiate into OLs. (Images A and B provided by Dr. Raquel Taveira-Marques.) (C) Pdgfra+ OPCs migrate throughout the developing cord and become evenly distributed in future gray and white matter before birth on ∼E18.5. (D) Specification of OPCs in the ventral human spinal cord follows a similar pattern as mouse; Olig2+ (green) neural stem cells in the pMN domain generate migratory OPCs. Many OPCs at the edges of the VZ coexpress Nkx2.2 (red) in humans. (Image kindly provided by Dr. Pantelis Tsouflas, University of Miami.) (E,F) Starting ∼E16.5 in mouse, some radial glia in the intermediate and dorsal spinal cord start to express OL lineage markers Olig2 and Sox10 (arrows) and transdifferentiate into OPCs. Here, green fluorescent protein (GFP) is expressed under the control of Dbx1, which is expressed in the VZ at the dorsoventral boundary of the cord. (From Fogarty et al. 2005; adapted, with permission, from the investigators). (G) A two-color reporter Sox10-GFP-STOP-tdTom (tandem-duplicated Tomato), when combined with a dorsally expressed Cre transgene Msx3-Cre, labels pMN-derived OPCs/OLs green and dorsally derived OPCs/OLs red. Dorsally derived OL lineage cells are ∼20% of the total and mainly populate dorsal and intermediate axon tracts (Tripathi et al. 2011). (H) OPCs in the gray matter of the wild-type postnatal cord are evenly spaced. (I) In NSE-Pdgf-A transgenic mice (which greatly overproduce Pdgf-A in neurons), OPCs (Pdgfra+) proliferate more than normal and pile up in tumor-like masses (van Heyningen et al. 2001). Pdgf-A overexpression also increases OPC numbers in adulthood (Woodruff et al. 2004). WT, wild type.
Figure 2.
Figure 2.
Development of the OL lineage in the forebrain. (A) In situ hybridization reveals that the first Pdgfra+ precursor cells appear in the ventral VZ (MGE) of the rat telencephalon (forerunner of the forebrain) ∼E13.5 (∼E12.5 in mice); some of these are OPCs that migrate through the developing forebrain, reaching the cortex (Cx) after ∼E17 (∼E16 in mice) (Tekki-Kessaris et al. 2001). Note that Pdgfra is expressed in many cells and tissues outside the CNS. (B) Lateral view of the developing rodent brain, indicating the plane of the section and the position of the Pdgfra+ cells in A. (C) After the first OPCs appear in the MGE (Nkx2.1 territory), a second “wave” of OPCs arises in the LGE (Gsx2 territory) and, after birth, a third wave within the cortical VZ (Emx1 territory). Cortically derived OPCs settle within the cortex and comprise ∼80% of all OPCs in the adult cortex (Tripathi et al. 2011). (D) A Sox10-driven green fluorescent protein–diphtheria toxin A chain (GFP–STOP-DTA) reporter illustrates the near-uniform distribution of OPCs in the perinatal mouse forebrain (very few OLs are present in the brain at birth). (D′) When the same Sox10 reporter is combined with three Cre transgenes (3xCre; Emx1-Cre, Gsx2-Cre, Nkx2.1-Cre), diphtheria toxin A chain (DTA) is expressed and kills the developing OPCs. (Images D and D′ from Iannarelli 2014.) Despite the fact that practically all telencephalic OPCs are eliminated at their source, the ventral forebrain is rapidly repopulated by OPCs that migrate forward from the diencephalon. At birth, the cortex is still almost devoid of OPCs, but is repopulated within the first 2 postnatal weeks; the mice survive and reproduce normally, although their body size is slightly reduced. Cx, cortex; MGE, medial ganglionic eminence; LGE, lateral ganglionic eminence; 3 V, third ventricle; CP, choroid plexus; Te, telencephalon; Di, diencephalon.
Figure 3.
Figure 3.
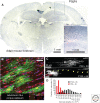
OPCs persist in the adult CNS. (A) In situ hybridization for Pdgfra reveals many OPCs scattered more or less uniformly throughout the adult brain (∼20-μm section). The inset shows a region of the cortex (marked by a rectangle) at higher magnification. (B) These adult OPCs continue to divide and generate myelinating oligodendrocytes (OLs) in the gray and white matter throughout at least the first year of life in mice (newborn OLs visualized in Pdgfra-CreERT2: Tau-mGFP transgenic mice, recombination induced by tamoxifen injection on P60 and analyzed 1 mo later. (Image kindly provided by Dr. Sarah Jolly.) (C) Adult-born (after P120, lower panel) OLs in the optic nerve have shorter internodes, but many more of them than OLs born earlier (e.g., after P30, upper panel). Tamoxifen was injected at P30 or P120 and the animals analyzed after 30 or 65 d, respectively. Adult-born OLs frequently also have one or two very long internodes (yellow arrows), which might represent first-time myelination of the very small number of unmyelinated axons present in the adult optic nerve. (D) Distributions of internode lengths of OLs born after P30 (red) or P120 (black). (Panels C and D from Young et al. 2013; reprinted, with permission, from Elsevier Limited © 2013.)
Figure 4.
Figure 4.
Synaptic signaling between neurons and oligodendrocyte precursor cells (OPCs). (A) Electron micrograph from a rat hippocampal brain slice in which one physiologically defined OPC was loaded with biocytin during a whole-cell recording and processed for peroxidase. A process of this cell (red asterisk) is visible as a postsynaptic partner to an axon terminal. (B) Whole-cell voltage-clamp recording from an OPC in the molecular layer of the cerebellum, showing the response to stimulation of a climbing fiber in control conditions, when cyclothiazide (CTZ) was used to block AMPA-receptor desensitization, and AMPA receptors were blocked with GYKI 53655. (C) Miniature excitatory postsynaptic currents (mEPSCs) recorded in the presence of tetrodotoxin (to block action-potential-dependent release of glutamate) from an OPC in the molecular layer of the cerebellum. Inset at bottom left shows the average mEPSC waveform and a single exponential fit (tau) to the rapid decay of the mEPSC. (D) Current-to-voltage relationship of EPSCs elicited in cerebellar OPCs by climbing fiber stimulation (open circles). Inclusion of the polyamine spermine increased inward rectification (filled circles), a hallmark of Ca2+-permeable AMPA receptors. Inset at top left shows selected responses from each configuration. (EG) Fluorescent images of OL lineage cells at different stages of maturation. Cells were filled with neurobiotin through the whole-cell electrode. The membrane properties of the cells are shown in the inset in the upper left. (HJ) Recordings of mEPSCs elicited in OPCs, premyelinating OLs (pre-OL) and mature OLs, by focal application of hypertonic solution during the indicated time periods (black bars). Note that mEPSCs are only observed in cells in the OPC stage. (Panel A adapted from Bergles et al. 2000; panels BD from Lin et al. 2005; reproduced, with permission, from Elsevier Limited © 2005; panel E based on data from De Biase et al. 2010.)
Figure 5.
Figure 5.
Homeostatic control of OPC density in the adult CNS. (A,B) Images of fluorescently labeled OPCs in the adult mouse somatosensory cortex (NG2-mEGFP mouse), collected using two-photon imaging through a cranial window. Individual cells have been digitally extracted from image stacks and pseudocolored. (A) Differentiation of the green cell is accompanied by division of the immediately adjacent blue cell to maintain a constant density of OPCs. (B) Death of the red cell is accompanied by division of the immediately adjacent blue cell; note that one of the blue sister cells migrates into the territory formerly occupied by the red cell. Time in days (d) is represented in the upper right corner. (C) Graph of the percentage of time that differentiation (white bar) or death (black bar) was associated with proliferation of an immediately adjacent OPC; the gray bar is the chance of observing proliferation of a neighbor. (D) Fluorescent image of three pseudocolored OPCs in vivo, as described above. Ablation of the yellow and magenta OPCs using the Ti:Sapphire laser–triggered division of the adjacent green OPC. h, hour. (E) Laser ablation of multiple OPCs triggers local proliferation and migration of nearby OPCs to fill the voids left by the ablated cells. Green dots represent the positions of the cell bodies of individual OPCs, red dots/lines represent the cell body positions after cell ablation. Cells targeted for ablation are circled in blue. (Adapted from data in Hughes et al. 2013.)

Similar articles

Cited by

References

    1. Agius E, Soukkarieh C, Danesin C, Kan P, Takebayashi H, Soula C, Cochard P. 2004. Converse control of oligodendrocyte and astrocyte lineage development by Sonic hedgehog in the chick spinal cord. Dev Biol 270: 308–321. - PubMed
    1. Ahlgren SC, Wallace H, Bishop J, Neophytou C, Raff MC. 1997. Effects of thyroid hormone on embryonic oligodendrocyte precursor cell development in vivo and in vitro. Mol Cell Neurosci 9: 420–432. - PubMed
    1. Anderson ES, Bjartmar C, Westermark G, Hildebrand C. 1999. Molecular heterogeneity of oligodendrocytes in chicken white matter. Glia 27: 15–21. - PubMed
    1. Arnett HA, Fancy SP, Alberta JA, Zhao C, Plant SR, Kaing S, Raine CS, Rowitch DH, Franklin RJ, Stiles CD. 2004. bHLH transcription factor Olig1 is required to repair demyelinated lesions in the CNS. Science 306: 2111–2115. - PubMed
    1. Assanah M, Lochhead R, Ogden A, Bruce J, Goldman J, Canoll P. 2006. Glial progenitors in adult white matter are driven to form malignant gliomas by platelet-derived growth factor-expressing retroviruses. J Neurosci 26: 6781–6790. - PMC - PubMed

Publication types

Substances