

Activation of placental insulin and mTOR signaling in a mouse model of maternal obesity associated with fetal overgrowth
- PMID: 26491103
- PMCID: PMC4796632
- DOI: 10.1152/ajpregu.00356.2015
Activation of placental insulin and mTOR signaling in a mouse model of maternal obesity associated with fetal overgrowth
Abstract
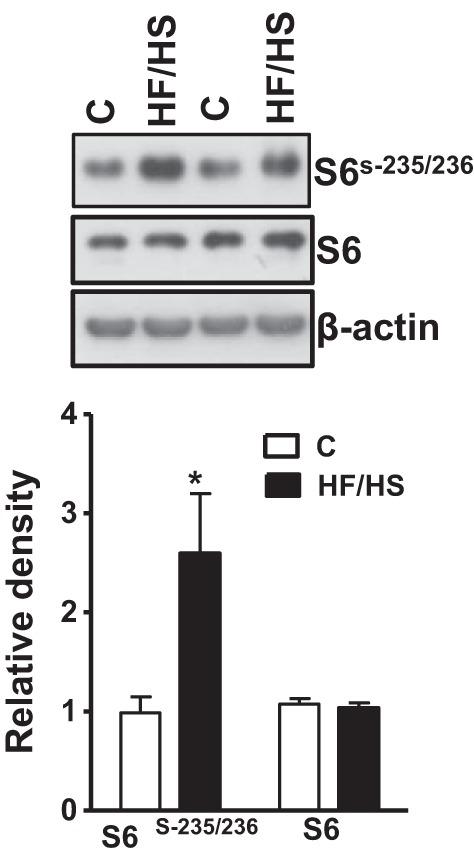
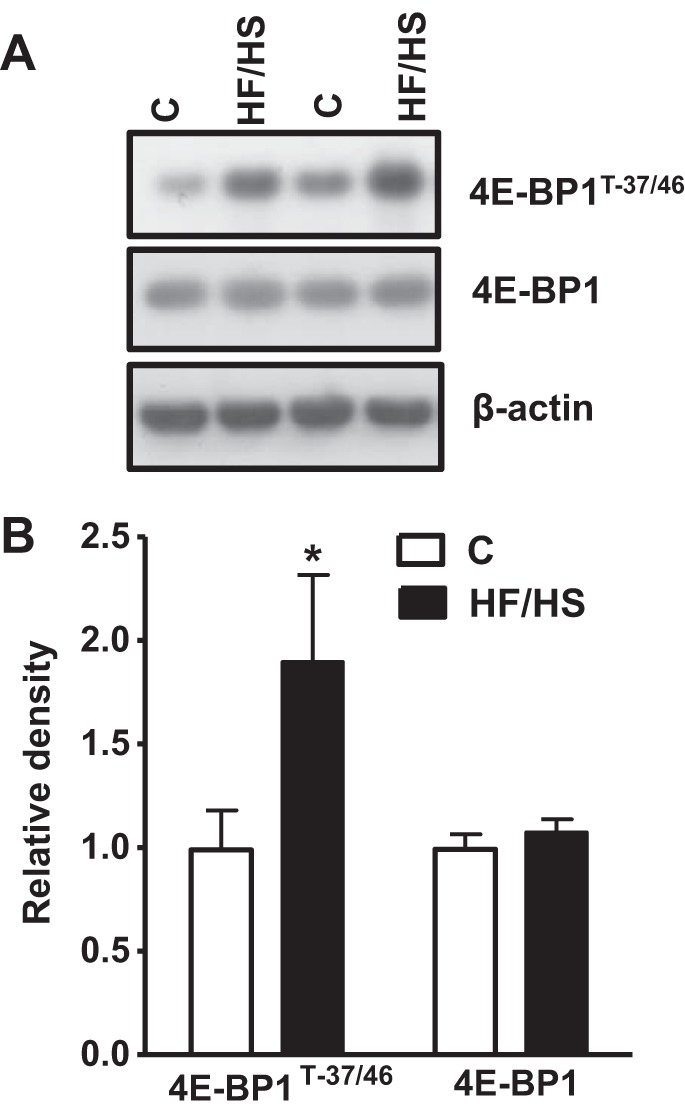
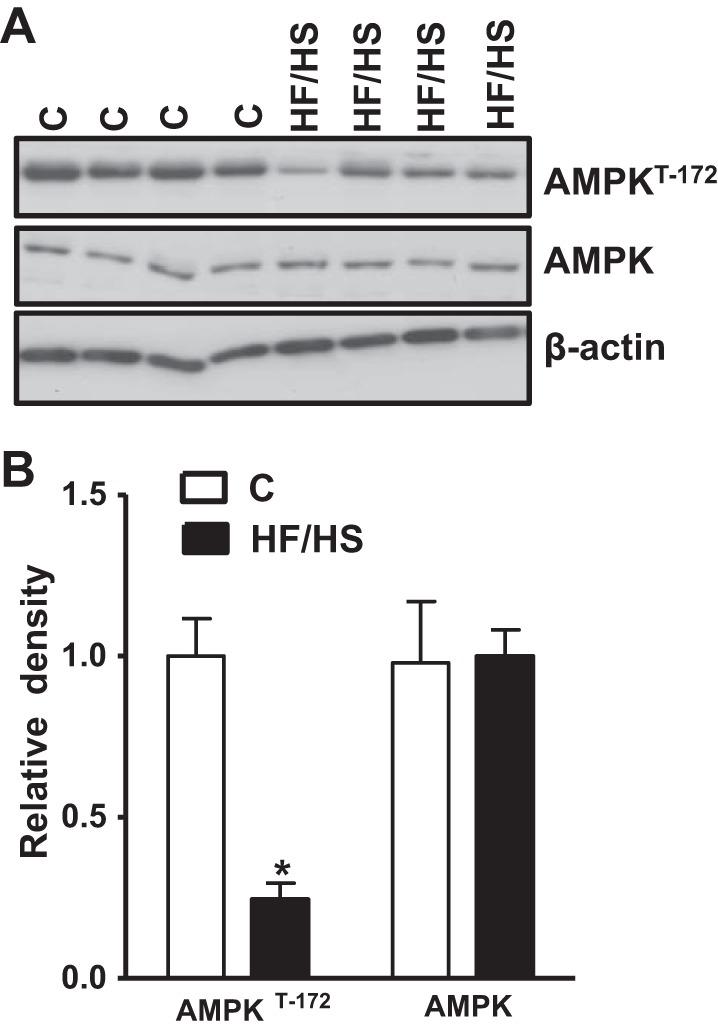
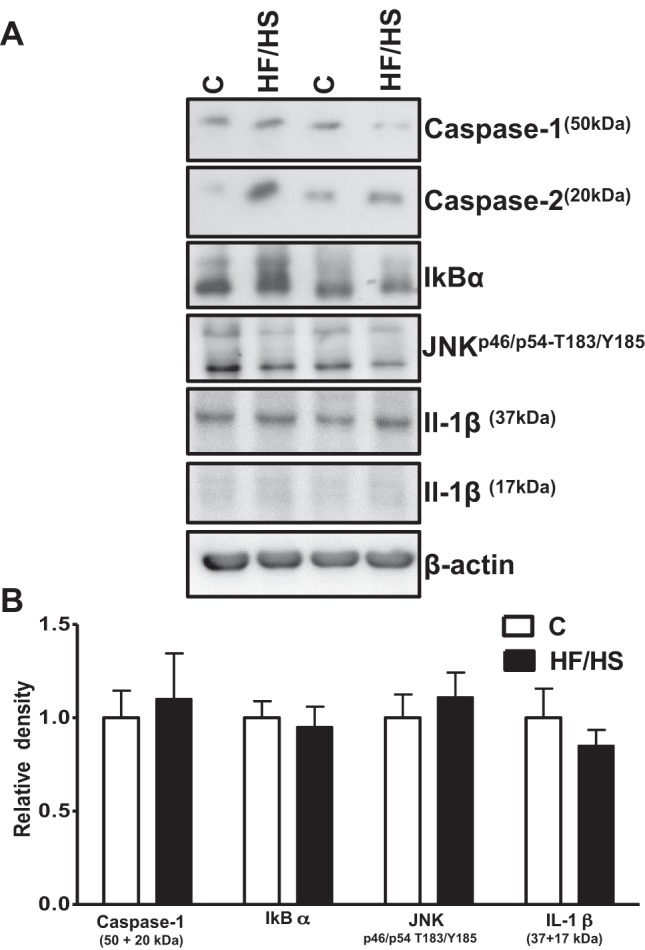
Fetal overgrowth is common in obese women and is associated with perinatal complications and increased risk for the child to develop metabolic syndrome later in life. Placental nutrient transport capacity has been reported to be increased in obese women giving birth to large infants; however, the underlying mechanisms are not well established. Obesity in pregnancy is characterized by elevated maternal serum insulin and leptin, hormones that stimulate placental amino acid transporters in vitro. We hypothesized that maternal obesity activates placental insulin/IGF-I/mTOR and leptin signaling pathways. We tested this hypothesis in a mouse model of obesity in pregnancy that is associated with fetal overgrowth. C57BL/6J female mice were fed a control (C) or a high-fat/high-sugar (HF/HS) pelleted diet supplemented by ad libitum access to sucrose (20%) solution. Placentas were collected at embryonic day 18.5. Using Western blot analysis, placental mTOR activity was determined along with energy, inflammatory, leptin, and insulin signaling pathways (upstream modulators of mTOR). Phosphorylation of S6 ribosomal protein (S-235/236), 4E-BP1 (T-37/46), Insulin receptor substrate 1 (Y-608), Akt (T-308), and STAT-3 (Y-705) was increased in obese dams. In contrast, expression of placental caspase-1, IкBα, IL-1β, and phosphorylated-JNK(p46/54-T183/Y185) was unaltered. Fetal amino acid availability is a key determinant of fetal growth. We propose that activation of placental insulin/IGF-I/mTOR and leptin signaling pathways in obese mice stimulates placental amino acid transport and contributes to increased fetal growth.
Keywords: fetal growth; fetal programming; intracellular signaling proteins; maternal-fetal exchange; pregnancy.
Copyright © 2016 the American Physiological Society.
Figures


Similar articles
-
Maternal overweight induced by a diet with high content of saturated fat activates placental mTOR and eIF2alpha signaling and increases fetal growth in rats.Biol Reprod. 2013 Oct 24;89(4):96. doi: 10.1095/biolreprod.113.109702. Print 2013 Oct. Biol Reprod. 2013. PMID: 24006279
-
Maternal protein restriction in the rat inhibits placental insulin, mTOR, and STAT3 signaling and down-regulates placental amino acid transporters.Endocrinology. 2011 Mar;152(3):1119-29. doi: 10.1210/en.2010-1153. Epub 2011 Feb 1. Endocrinology. 2011. PMID: 21285325 Free PMC article.
-
Increased placental nutrient transport in a novel mouse model of maternal obesity with fetal overgrowth.Obesity (Silver Spring). 2015 Aug;23(8):1663-70. doi: 10.1002/oby.21165. Obesity (Silver Spring). 2015. PMID: 26193061 Free PMC article.
-
Placental function in maternal obesity.Clin Sci (Lond). 2020 Apr 30;134(8):961-984. doi: 10.1042/CS20190266. Clin Sci (Lond). 2020. PMID: 32313958 Free PMC article. Review.
-
Placental regulation of fetal nutrient supply.Curr Opin Clin Nutr Metab Care. 2013 May;16(3):292-7. doi: 10.1097/MCO.0b013e32835e3674. Curr Opin Clin Nutr Metab Care. 2013. PMID: 23416721 Review.
Cited by
-
Placental mTOR Signaling and Sexual Dimorphism in Metabolic Health across the Lifespan of Offspring.Children (Basel). 2021 Oct 26;8(11):970. doi: 10.3390/children8110970. Children (Basel). 2021. PMID: 34828683 Free PMC article. Review.
-
Infant Mesenchymal Stem Cell Insulin Action Is Associated With Maternal Plasma Free Fatty Acids, Independent of Obesity Status: The Healthy Start Study.Diabetes. 2022 Aug 1;71(8):1649-1659. doi: 10.2337/db21-0812. Diabetes. 2022. PMID: 35621990 Free PMC article.
-
Novel roles of mechanistic target of rapamycin signaling in regulating fetal growth†.Biol Reprod. 2019 Apr 1;100(4):872-884. doi: 10.1093/biolre/ioy249. Biol Reprod. 2019. PMID: 30476008 Free PMC article. Review.
-
Normalisation of circulating adiponectin levels in obese pregnant mice prevents cardiac dysfunction in adult offspring.Int J Obes (Lond). 2020 Feb;44(2):488-499. doi: 10.1038/s41366-019-0374-4. Epub 2019 May 10. Int J Obes (Lond). 2020. PMID: 31076636 Free PMC article.
-
Obesogenic diet in pregnancy disrupts placental iron handling and ferroptosis and stress signalling in association with fetal growth alterations.Cell Mol Life Sci. 2024 Mar 25;81(1):151. doi: 10.1007/s00018-024-05192-5. Cell Mol Life Sci. 2024. PMID: 38526599 Free PMC article.
References
-
- Ahlsson FS, Diderholm B, Ewald U, Gustafsson J. Lipolysis and insulin sensitivity at birth in infants who are large for gestational age. Pediatrics 120: 958–965, 2007. - PubMed
Publication types
MeSH terms
Substances
Grants and funding
LinkOut - more resources
Full Text Sources
Other Literature Sources
Medical
Molecular Biology Databases
Research Materials
Miscellaneous