Methods for biological data integration: perspectives and challenges
- PMID: 26490630
- PMCID: PMC4685837
- DOI: 10.1098/rsif.2015.0571
Methods for biological data integration: perspectives and challenges
Abstract
Rapid technological advances have led to the production of different types of biological data and enabled construction of complex networks with various types of interactions between diverse biological entities. Standard network data analysis methods were shown to be limited in dealing with such heterogeneous networked data and consequently, new methods for integrative data analyses have been proposed. The integrative methods can collectively mine multiple types of biological data and produce more holistic, systems-level biological insights. We survey recent methods for collective mining (integration) of various types of networked biological data. We compare different state-of-the-art methods for data integration and highlight their advantages and disadvantages in addressing important biological problems. We identify the important computational challenges of these methods and provide a general guideline for which methods are suited for specific biological problems, or specific data types. Moreover, we propose that recent non-negative matrix factorization-based approaches may become the integration methodology of choice, as they are well suited and accurate in dealing with heterogeneous data and have many opportunities for further development.
Keywords: biological networks; data fusion; heterogeneous data integration; non-negative matrix factorization; omics data; systems biology.
© 2015 The Author(s).
Figures


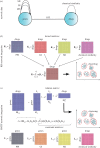
 . (b) An example of a naive BN with a class node y being the parent to independent nodes x1, x2 , … , xN.
Similar articles
-
Heterogeneous Multi-Layered Network Model for Omics Data Integration and Analysis.Front Genet. 2020 Jan 28;10:1381. doi: 10.3389/fgene.2019.01381. eCollection 2019. Front Genet. 2020. PMID: 32063919 Free PMC article. Review.
-
Translational Metabolomics of Head Injury: Exploring Dysfunctional Cerebral Metabolism with Ex Vivo NMR Spectroscopy-Based Metabolite Quantification.In: Kobeissy FH, editor. Brain Neurotrauma: Molecular, Neuropsychological, and Rehabilitation Aspects. Boca Raton (FL): CRC Press/Taylor & Francis; 2015. Chapter 25. In: Kobeissy FH, editor. Brain Neurotrauma: Molecular, Neuropsychological, and Rehabilitation Aspects. Boca Raton (FL): CRC Press/Taylor & Francis; 2015. Chapter 25. PMID: 26269925 Free Books & Documents. Review.
-
Independent Component Analysis for Unraveling the Complexity of Cancer Omics Datasets.Int J Mol Sci. 2019 Sep 7;20(18):4414. doi: 10.3390/ijms20184414. Int J Mol Sci. 2019. PMID: 31500324 Free PMC article. Review.
-
DrugNet: network-based drug-disease prioritization by integrating heterogeneous data.Artif Intell Med. 2015 Jan;63(1):41-9. doi: 10.1016/j.artmed.2014.11.003. Epub 2015 Jan 13. Artif Intell Med. 2015. PMID: 25704113
-
Integrative approaches to reconstruct regulatory networks from multi-omics data: A review of state-of-the-art methods.Comput Biol Chem. 2019 Dec;83:107120. doi: 10.1016/j.compbiolchem.2019.107120. Epub 2019 Sep 6. Comput Biol Chem. 2019. PMID: 31499298 Review.
Cited by
-
iSMNN: batch effect correction for single-cell RNA-seq data via iterative supervised mutual nearest neighbor refinement.Brief Bioinform. 2021 Sep 2;22(5):bbab122. doi: 10.1093/bib/bbab122. Brief Bioinform. 2021. PMID: 33839756 Free PMC article.
-
Multiview learning for understanding functional multiomics.PLoS Comput Biol. 2020 Apr 2;16(4):e1007677. doi: 10.1371/journal.pcbi.1007677. eCollection 2020 Apr. PLoS Comput Biol. 2020. PMID: 32240163 Free PMC article. Review.
-
Machine and deep learning meet genome-scale metabolic modeling.PLoS Comput Biol. 2019 Jul 11;15(7):e1007084. doi: 10.1371/journal.pcbi.1007084. eCollection 2019 Jul. PLoS Comput Biol. 2019. PMID: 31295267 Free PMC article. Review.
-
Genetic cooperativity in multi-layer networks implicates cell survival and senescence in the striatum of Huntington's disease mice synchronous to symptoms.Bioinformatics. 2020 Jan 1;36(1):186-196. doi: 10.1093/bioinformatics/btz514. Bioinformatics. 2020. PMID: 31228193 Free PMC article.
-
Design and evaluation of a web-based electronic health record for amblyopia.Front Med (Lausanne). 2024 Apr 4;11:1322821. doi: 10.3389/fmed.2024.1322821. eCollection 2024. Front Med (Lausanne). 2024. PMID: 38638930 Free PMC article.
References
Publication types
MeSH terms
LinkOut - more resources
Full Text Sources
Other Literature Sources

