Dynamics of histone H3 acetylation in the nucleosome core during mouse pre-implantation development
- PMID: 26479850
- PMCID: PMC4990223
- DOI: 10.1080/15592294.2015.1103424
Dynamics of histone H3 acetylation in the nucleosome core during mouse pre-implantation development
Abstract
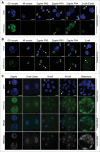
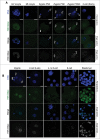
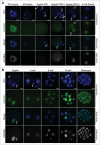
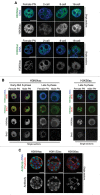
In mammals, the time period that follows fertilization is characterized by extensive chromatin remodeling, which enables epigenetic reprogramming of the gametes. Major changes in chromatin structure persist until the time of implantation, when the embryo develops into a blastocyst, which comprises the inner cell mass and the trophectoderm. Changes in DNA methylation, histone variant incorporation, and covalent modifications of the histones tails have been intensively studied during pre-implantation development. However, modifications within the core of the nucleosomes have not been systematically analyzed. Here, we report the first characterization and temporal analysis of 3 key acetylated residues in the core of the histone H3: H3K64ac, H3K122ac, and H3K56ac, all located at structurally important positions close to the DNA. We found that all 3 acetylations occur during pre-implantation development, but with different temporal kinetics. Globally, H3K64ac and H3K56ac were detected throughout cleavage stages, while H3K122ac was only weakly detectable during this time. Our work contributes to the understanding of the contribution of histone modifications in the core of the nucleosome to the "marking" of the newly established embryonic chromatin and unveils new modification pathways potentially involved in epigenetic reprogramming.
Keywords: Epigenetics; histone acetylation; lateral surface; mammalian embryo; nucleosome core.
Figures


Similar articles
-
Dynamic pattern of histone H3 core acetylation in human early embryos.Cell Cycle. 2020 Sep;19(17):2226-2234. doi: 10.1080/15384101.2020.1806433. Epub 2020 Aug 14. Cell Cycle. 2020. PMID: 32794422 Free PMC article.
-
Acetylation of histone H3 at lysine 64 regulates nucleosome dynamics and facilitates transcription.Elife. 2014 Mar 25;3:e01632. doi: 10.7554/eLife.01632. Elife. 2014. PMID: 24668167 Free PMC article.
-
Histone modification: cause or cog?Trends Genet. 2011 Oct;27(10):389-96. doi: 10.1016/j.tig.2011.06.006. Epub 2011 Jul 20. Trends Genet. 2011. PMID: 21764166
-
A brief histone in time: understanding the combinatorial functions of histone PTMs in the nucleosome context.Biochem Cell Biol. 2016 Feb;94(1):33-42. doi: 10.1139/bcb-2015-0031. Epub 2015 Jun 3. Biochem Cell Biol. 2016. PMID: 26197985 Review.
-
A modified epigenetics toolbox to study histone modifications on the nucleosome core.Chembiochem. 2011 Jan 24;12(2):308-13. doi: 10.1002/cbic.201000617. Epub 2010 Dec 29. Chembiochem. 2011. PMID: 21243718 Review.
Cited by
-
Nutritional Status Impacts Epigenetic Regulation in Early Embryo Development: A Scoping Review.Adv Nutr. 2021 Oct 1;12(5):1877-1892. doi: 10.1093/advances/nmab038. Adv Nutr. 2021. PMID: 33873200 Free PMC article. Review.
-
Epigenetic Reprogramming During Somatic Cell Nuclear Transfer: Recent Progress and Future Directions.Front Genet. 2020 Mar 18;11:205. doi: 10.3389/fgene.2020.00205. eCollection 2020. Front Genet. 2020. PMID: 32256519 Free PMC article. Review.
-
When Dad's Stress Gets under Kid's Skin-Impacts of Stress on Germline Cargo and Embryonic Development.Biomolecules. 2023 Dec 6;13(12):1750. doi: 10.3390/biom13121750. Biomolecules. 2023. PMID: 38136621 Free PMC article. Review.
-
Genome-wide identification and expression analysis of the JMJ-C gene family in melon (Cucumis melo L.) reveals their potential role in fruit development.BMC Genomics. 2023 Dec 13;24(1):771. doi: 10.1186/s12864-023-09868-3. BMC Genomics. 2023. PMID: 38093236 Free PMC article.
-
Dynamic pattern of histone H3 core acetylation in human early embryos.Cell Cycle. 2020 Sep;19(17):2226-2234. doi: 10.1080/15384101.2020.1806433. Epub 2020 Aug 14. Cell Cycle. 2020. PMID: 32794422 Free PMC article.
References
-
- Kouzarides T. Chromatin modifications and their function. Cell 2007; 128:693-705; PMID:17320507; http://dx.doi.org/10.1016/j.cell.2007.02.005 - DOI - PubMed
-
- Strahl BD, Allis CD. The language of covalent histone modifications. Nature 2000; 403:41-5; PMID:10638745; http://dx.doi.org/10.1038/47412 - DOI - PubMed
-
- Vermeulen M, Mulder KW, Denissov S, Pijnappel WW, van Schaik FM, Varier RA, Baltissen MP, Stunnenberg HG, Mann M, Timmers HT. Selective anchoring of TFIID to nucleosomes by trimethylation of histone H3 lysine 4. Cell 2007; 131:58-69; PMID:17884155; http://dx.doi.org/10.1016/j.cell.2007.08.016 - DOI - PubMed
-
- Kamieniarz K, Izzo A, Dundr M, Tropberger P, Ozretic L, Kirfel J, Scheer E, Tropel P, Wisniewski JR, Tora L, et al.. A dual role of linker histone H1.4 Lys 34 acetylation in transcriptional activation. Genes Dev 2011; 26:797-802; http://dx.doi.org/10.1101/gad.182014.111 - DOI - PMC - PubMed
-
- Luger K, Mader AW, Richmond RK, Sargent DF, Richmond TJ. Crystal structure of the nucleosome core particle at 2.8 A resolution. Nature 1997; 389:251-60; PMID:9305837; http://dx.doi.org/10.1038/38444 - DOI - PubMed
MeSH terms
Substances
Grants and funding
LinkOut - more resources
Full Text Sources
Other Literature Sources
