

HPV16-E2 induces prophase arrest and activates the cellular DNA damage response in vitro and in precursor lesions of cervical carcinoma
- PMID: 26474276
- PMCID: PMC4741503
- DOI: 10.18632/oncotarget.5512
HPV16-E2 induces prophase arrest and activates the cellular DNA damage response in vitro and in precursor lesions of cervical carcinoma
Abstract
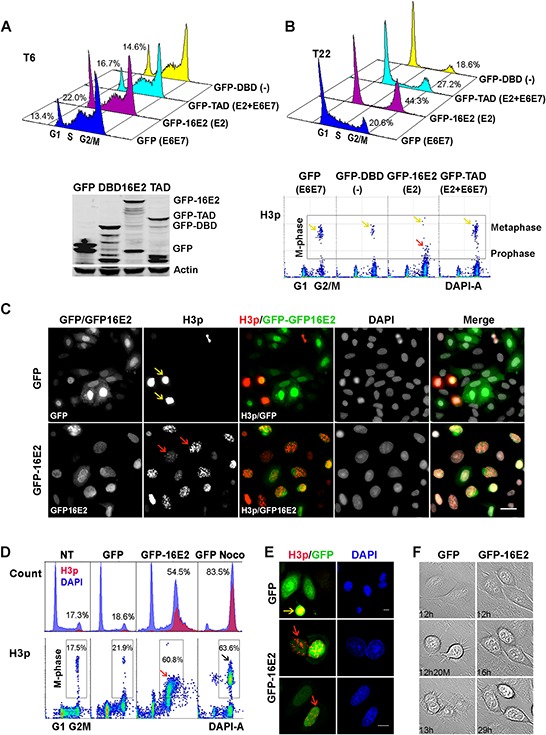
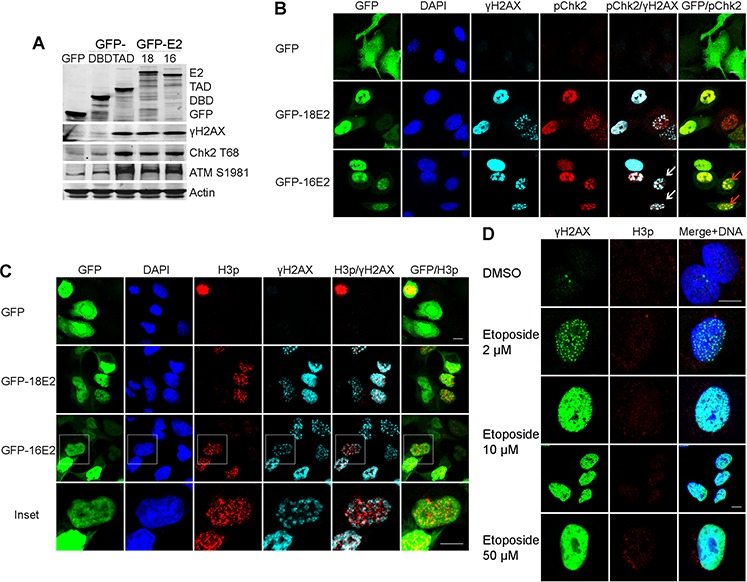
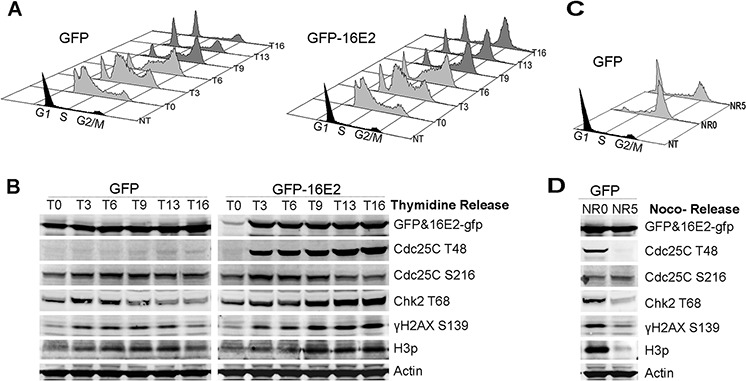
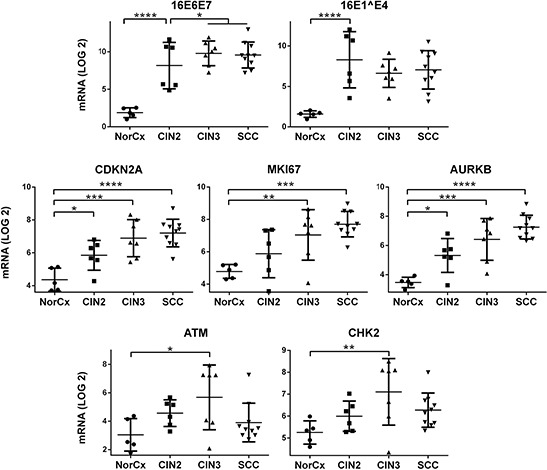
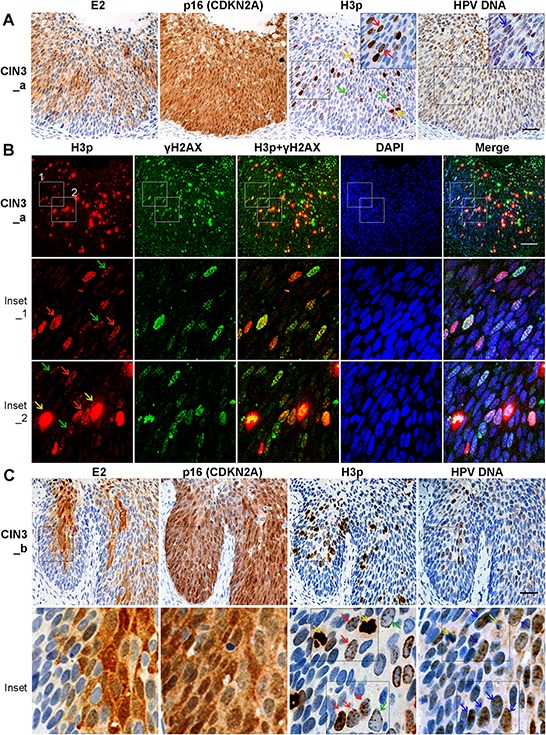
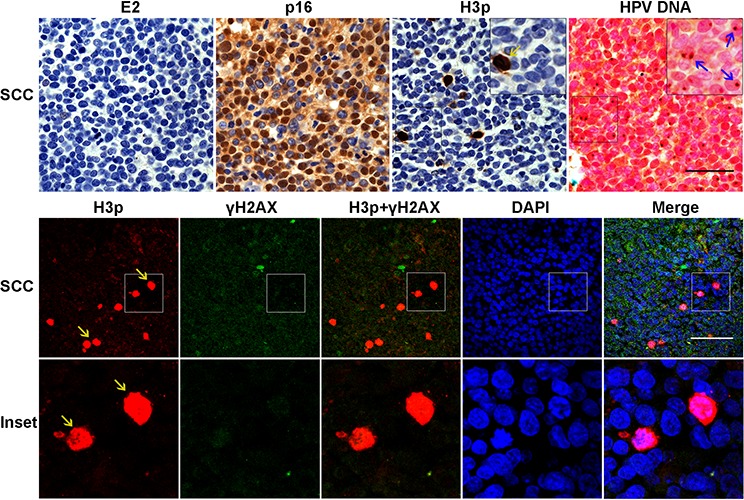
Cervical intraepithelial neoplasia (CIN) is caused by human papillomavirus (HPV) infection and is the precursor to cervical carcinoma. The completion of the HPV productive life cycle depends on the expression of viral proteins which further determines the severity of the cervical neoplasia. Initiation of the viral productive replication requires expression of the E2 viral protein that cooperates with the E1 viral DNA helicase. A decrease in the viral DNA replication ability and increase in the severity of cervical neoplasia is accompanied by simultaneous elevated expression of E6 and E7 oncoproteins. Here we reveal a novel and important role for the HPV16-E2 protein in controlling host cell cycle during malignant transformation. We showed that cells expressing HPV16-E2 in vitro are arrested in prophase alongside activation of a sustained DDR signal. We uncovered evidence that HPV16-E2 protein is present in vivo in cells that express both mitotic and DDR signals specifically in CIN3 lesions, immediate precursors of cancer, suggesting that E2 may be one of the drivers of genomic instability and carcinogenesis in vivo.
Keywords: DNA damage response; HPV16-E2; cell cycle; cervical intraepithelial neoplasia; prophase.
Conflict of interest statement
The authors declare no conflict of interest.
Figures
Similar articles
-
Viral DNA load, physical status and E2/E6 ratio as markers to grade HPV16 positive women for high-grade cervical lesions.Gynecol Oncol. 2007 Sep;106(3):549-57. doi: 10.1016/j.ygyno.2007.05.004. Epub 2007 Jun 13. Gynecol Oncol. 2007. PMID: 17568661
-
HPV16 E2 is an immediate early marker of viral infection, preceding E7 expression in precursor structures of cervical carcinoma.Cancer Res. 2010 Jul 1;70(13):5316-25. doi: 10.1158/0008-5472.CAN-09-3789. Epub 2010 Jun 8. Cancer Res. 2010. PMID: 20530671
-
Human papillomavirus 16 E6/E7 transcript and E2 gene status in patients with cervical neoplasia.Mol Diagn. 2004;8(1):57-64. doi: 10.1007/BF03260048. Mol Diagn. 2004. PMID: 15230643
-
[Cellular and molecular pathogenesis of cancer of the cervix].Contracept Fertil Sex. 1995 Dec;23(12):731-40. Contracept Fertil Sex. 1995. PMID: 8556072 Review. French.
-
Clinical implications of (epi)genetic changes in HPV-induced cervical precancerous lesions.Nat Rev Cancer. 2014 Jun;14(6):395-405. doi: 10.1038/nrc3728. Nat Rev Cancer. 2014. PMID: 24854082 Review.
Cited by
-
Chenopodium Botrys Essential Oil as A Source of Sesquiterpenes to Induce Apoptosis and G1 Cell Cycle Arrest in Cervical Cancer Cells.Iran J Pharm Res. 2020 Spring;19(2):341-351. doi: 10.22037/ijpr.2019.1100671. Iran J Pharm Res. 2020. PMID: 33224241 Free PMC article.
-
Immortalization capacity of HPV types is inversely related to chromosomal instability.Oncotarget. 2016 Jun 21;7(25):37608-37621. doi: 10.18632/oncotarget.8058. Oncotarget. 2016. PMID: 26993771 Free PMC article.
-
Association of antibody to E2 protein of human papillomavirus and p16INK4A with progression of HPV-infected cervical lesions.Med Oncol. 2018 May 9;35(6):93. doi: 10.1007/s12032-018-1151-2. Med Oncol. 2018. PMID: 29744680
-
New insights for gynecological cancer therapies: from molecular mechanisms and clinical evidence to future directions.Cancer Metastasis Rev. 2023 Sep;42(3):891-925. doi: 10.1007/s10555-023-10113-2. Epub 2023 Jun 27. Cancer Metastasis Rev. 2023. PMID: 37368179 Free PMC article. Review.
-
The hot-spot p53R172H mutant promotes formation of giant spermatogonia triggered by DNA damage.Oncogene. 2017 Apr 6;36(14):2002-2013. doi: 10.1038/onc.2016.374. Epub 2016 Nov 21. Oncogene. 2017. PMID: 27869164 Free PMC article.
References
-
- Agorastos T, Miliaras D, Lambropoulos AF, Chrisafi S, Kotsis A, Manthos A, Bontis J. Detection and typing of human papillomavirus DNA in uterine cervices with coexistent grade I and grade III intraepithelial neoplasia: biologic progression or independent lesions? Eur J Obstet Gynecol Reprod Biol. 2005;121:99–103. - PubMed
-
- Syrjanen K, Shabalova I, Naud P, Kozachenko V, Derchain S, Zakharchenko S, Roteli-Martins C, Nerovjna R, Longatto-Filho A, Kljukina L, Tatti S, Branovskaja M, Hammes LS, Branca M, Grunjberga V, Erzen M, et al. Persistent high-risk human papillomavirus infections and other end-point markers of progressive cervical disease among women prospectively followed up in the New Independent States of the Former Soviet Union and the Latin American Screening study cohorts. Int J Gynecol Cancer. 2009;19:934–942. - PubMed
-
- McCredie MR, Sharples KJ, Paul C, Baranyai J, Medley G, Jones RW, Skegg DC. Natural history of cervical neoplasia and risk of invasive cancer in women with cervical intraepithelial neoplasia 3: a retrospective cohort study. Lancet Oncol. 2008;9:425–434. - PubMed
-
- Schiffman M, Rodriguez AC. Heterogeneity in CIN3 diagnosis. Lancet Oncol. 2008;9:404–406. - PubMed
Publication types
MeSH terms
Substances
LinkOut - more resources
Full Text Sources
Other Literature Sources
Medical
