

Reduced keratin expression in colorectal neoplasia and associated fields is reversible by diet and resection
- PMID: 26462274
- PMCID: PMC4599164
- DOI: 10.1136/bmjgast-2014-000022
Reduced keratin expression in colorectal neoplasia and associated fields is reversible by diet and resection
Abstract
Background: Patients with adenomatous colonic polyps are at increased risk of developing further polyps suggesting field-wide alterations in cancer predisposition. The current study aimed to identify molecular alterations in the normal mucosa in the proximity of adenomatous polyps and to assess the modulating effect of butyrate, a chemopreventive compound produced by fermentation of dietary residues.
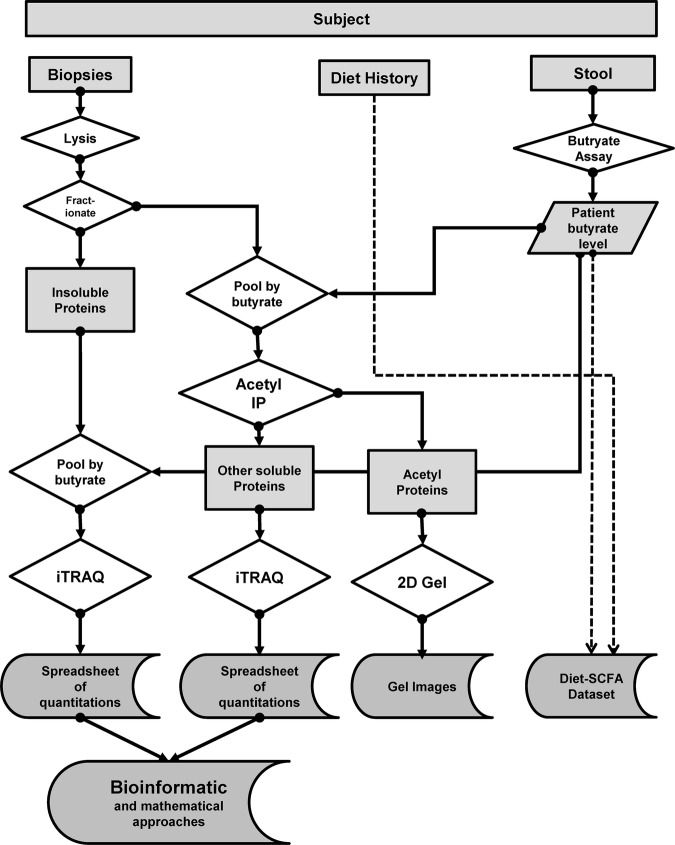
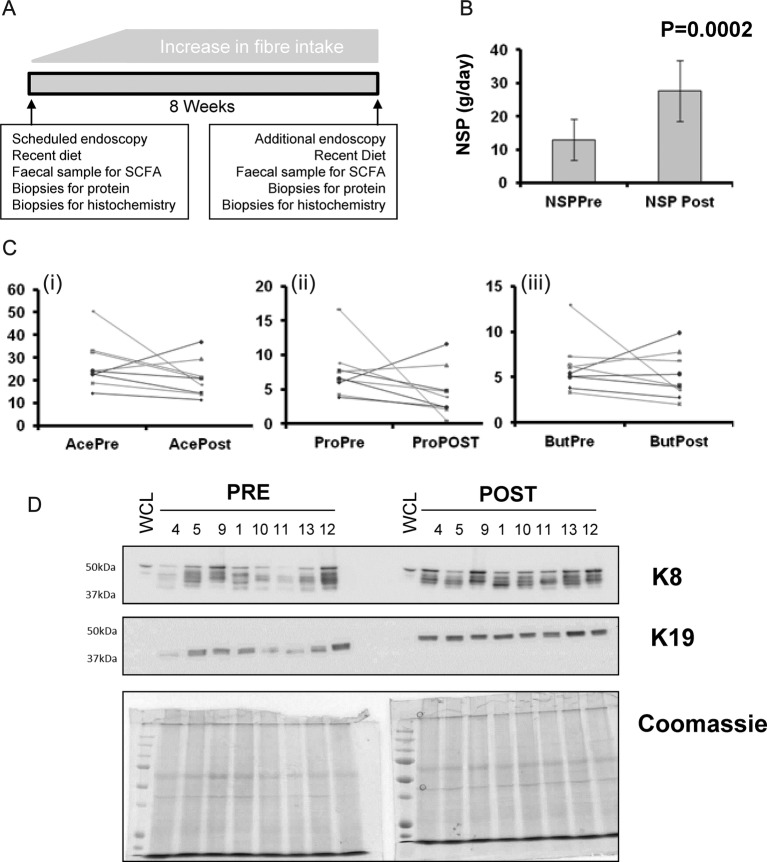
Methods: A cross-sectional study was undertaken in patients with adenomatous polyps: biopsy samples were taken from the adenoma, and from macroscopically normal mucosa on the contralateral wall to the adenoma and from the mid-sigmoid colon. In normal subjects biopsies were taken from the mid-sigmoid colon. Biopsies were frozen for proteomic analysis or formalin-fixed for immunohistochemistry. Proteomic analysis was undertaken using iTRAQ workflows followed by bioinformatics analyses. A second dietary fibre intervention study arm used the same endpoints and sampling strategy at the beginning and end of a high-fibre intervention.
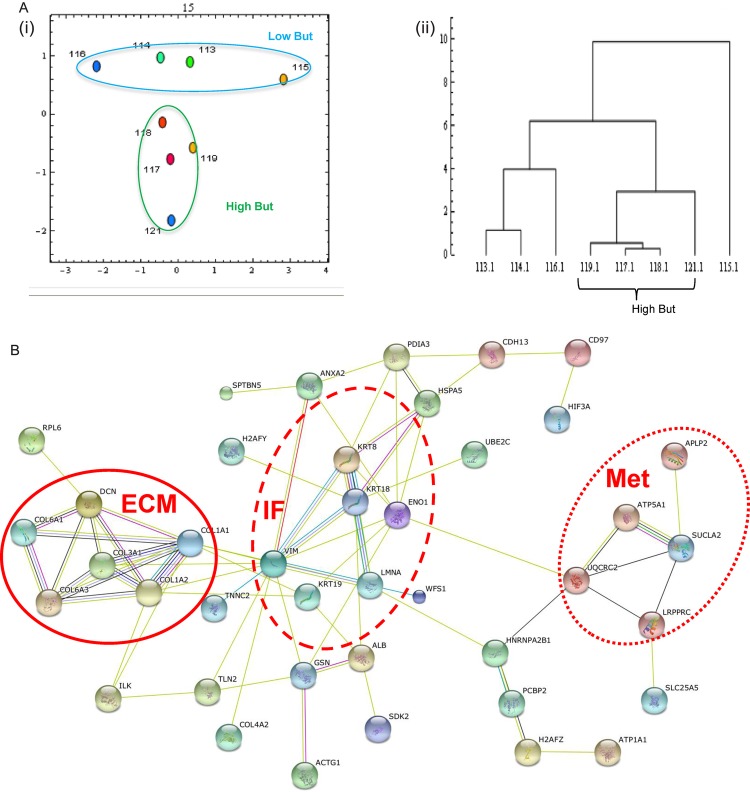
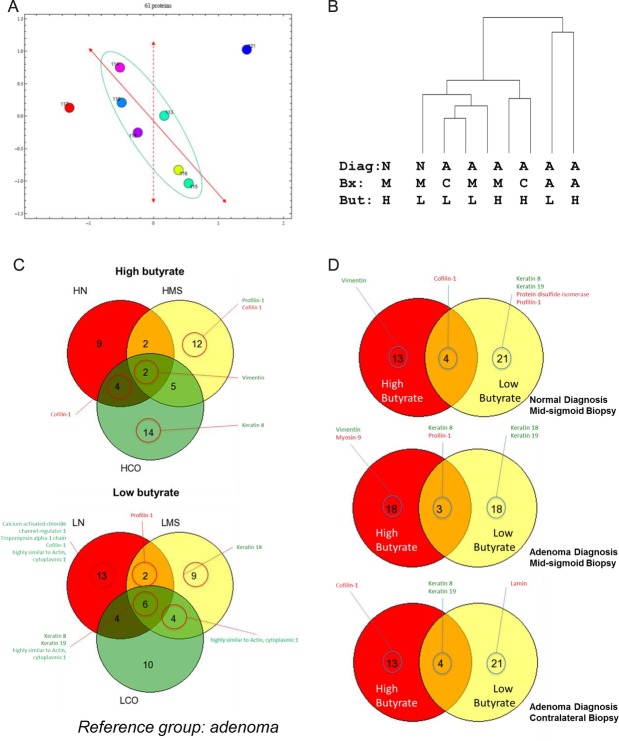
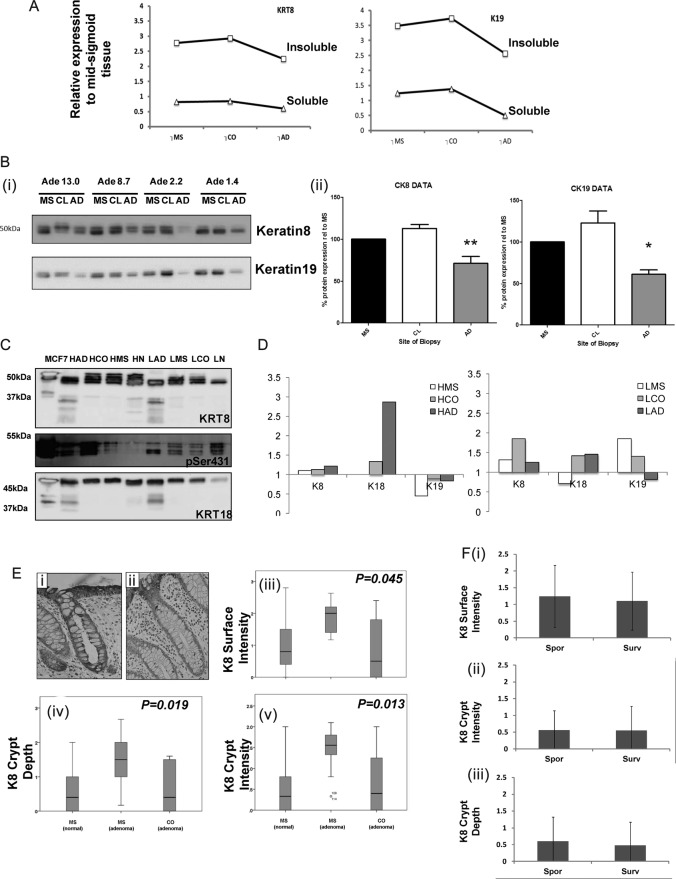
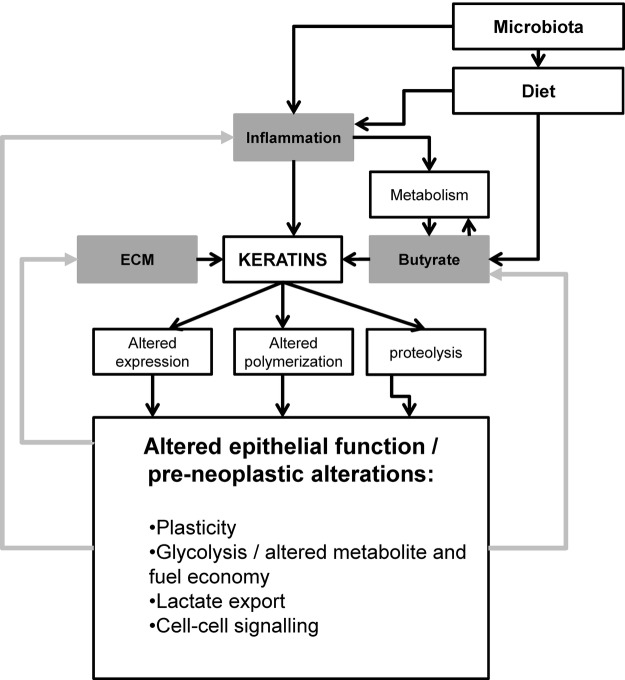
Results: Key findings were that keratins 8, 18 and 19 were reduced in expression level with progressive proximity to the lesion. Lesional tissue exhibited multiple K8 immunoreactive bands and overall reduced levels of keratin. Biopsies from normal subjects with low faecal butyrate also showed depressed keratin expression. Resection of the lesion and elevation of dietary fibre intake both appeared to restore keratin expression level.
Conclusion: Changes in keratin expression associate with progression towards neoplasia, but remain modifiable risk factors. Dietary strategies may improve secondary chemoprevention.
Trial registration number: ISRCTN90852168.
Keywords: ADENOMA; BUTYRATE; CYTOKERATINS; DIETARY FIBRE.
Figures
Similar articles
-
Keratin 8 expression in colon cancer associates with low faecal butyrate levels.BMC Gastroenterol. 2011 Jan 10;11:2. doi: 10.1186/1471-230X-11-2. BMC Gastroenterol. 2011. PMID: 21219647 Free PMC article.
-
Dietary fibre for the prevention of recurrent colorectal adenomas and carcinomas.Cochrane Database Syst Rev. 2017 Jan 8;1(1):CD003430. doi: 10.1002/14651858.CD003430.pub2. Cochrane Database Syst Rev. 2017. PMID: 28064440 Free PMC article. Review.
-
A study protocol to investigate the relationship between dietary fibre intake and fermentation, colon cell turnover, global protein acetylation and early carcinogenesis: the FACT study.BMC Cancer. 2009 Sep 18;9:332. doi: 10.1186/1471-2407-9-332. BMC Cancer. 2009. PMID: 19765278 Free PMC article. Clinical Trial.
-
Colonic fermentation of dietary fibre to short chain fatty acids in patients with adenomatous polyps and colonic cancer.Gut. 1991 Aug;32(8):923-8. doi: 10.1136/gut.32.8.923. Gut. 1991. PMID: 1653178 Free PMC article.
-
Dietary fibre for the prevention of colorectal adenomas and carcinomas.Cochrane Database Syst Rev. 2002;(2):CD003430. doi: 10.1002/14651858.CD003430. Cochrane Database Syst Rev. 2002. Update in: Cochrane Database Syst Rev. 2017 Jan 08;1:CD003430. doi: 10.1002/14651858.CD003430.pub2. PMID: 12076480 Updated. Review.
Cited by
-
Feasibility of CYFRA 21-1 as a serum biomarker for the detection of colorectal adenoma and advanced colorectal adenoma in people over the age of 45.J Clin Lab Anal. 2018 Jan;32(1):e22163. doi: 10.1002/jcla.22163. Epub 2017 Feb 10. J Clin Lab Anal. 2018. PMID: 28186354 Free PMC article.
-
Traditional chinese medicine syndromes classification associates with tumor cell and microenvironment heterogeneity in colorectal cancer: a single cell RNA sequencing analysis.Chin Med. 2021 Dec 7;16(1):133. doi: 10.1186/s13020-021-00547-7. Chin Med. 2021. PMID: 34876190 Free PMC article.
References
-
- Slaughter DP, Southwick HW, Smejkal W. Field cancerization in oral stratified squamous epithelium—clinical implications of multicentric origin. Cancer 1953;6:963–8. doi:10.1002/1097-0142(195309)6:5<963::AID-CNCR2820060515>3.0.CO;2-Q - DOI - PubMed
-
- Rosser R, C KC, Corfe BM. Models for field effects in metachronous colorectal neoplasms. Int J Exp Pathol; in revision.
-
- Polley ACJ, Mulholland F, Pin C, et al. . Proteomic analysis reveals field-wide changes in protein expression in the morphologically normal mucosa of patients with colorectal neoplasia. Cancer Res 2006;66:6553–62. doi:10.1158/0008-5472.CAN-06-0534 - DOI - PubMed
-
- Humphries A, Wright NA. Colonic crypt organization and tumorigenesis. Nat Rev Cancer 2008;8:415–24. doi:10.1038/nrc2392 - DOI - PubMed
LinkOut - more resources
Full Text Sources
Other Literature Sources
Research Materials
Miscellaneous