. 2015 Nov 12;527(7577):198-203.
doi: 10.1038/nature14958. Epub 2015 Oct 5.

Cryo-electron microscopy structure of the Slo2.2 Na(+)-activated K(+) channel

Affiliations

Cryo-electron microscopy structure of the Slo2.2 Na(+)-activated K(+) channel

Richard K Hite et al. Nature. .

Abstract

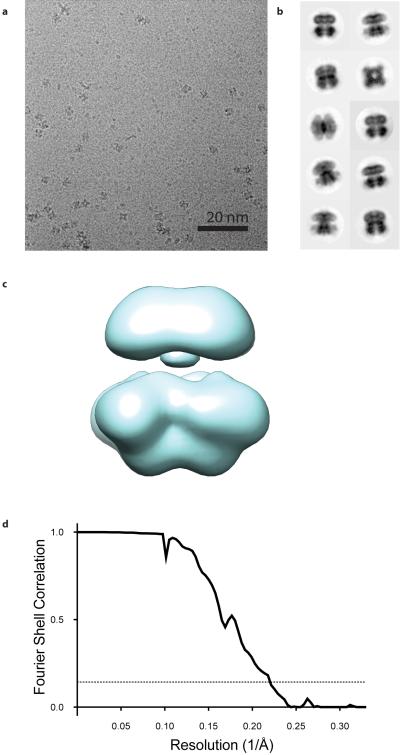
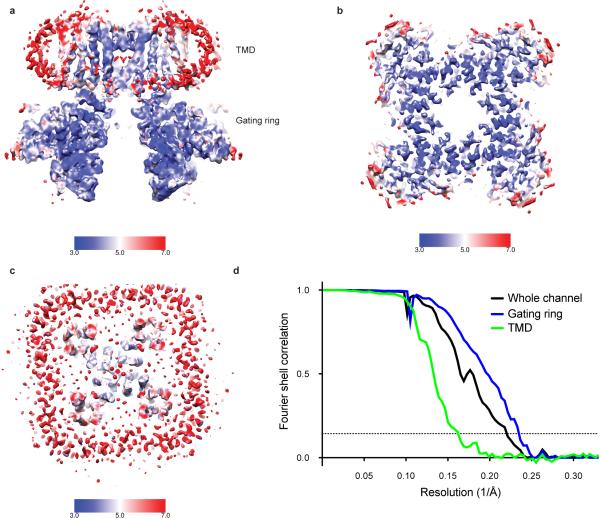
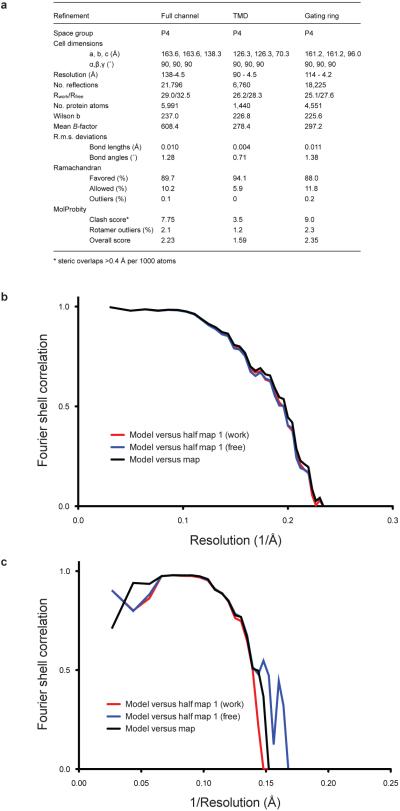
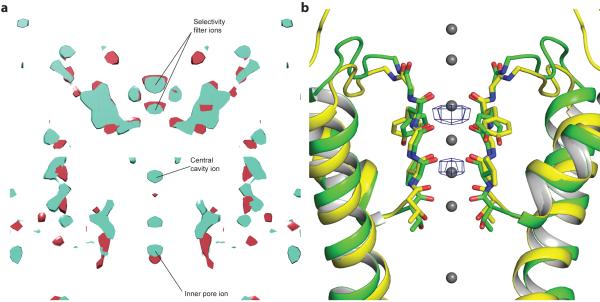
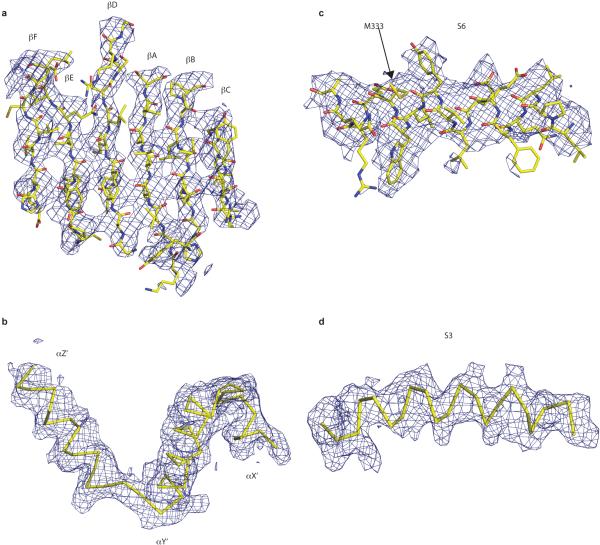
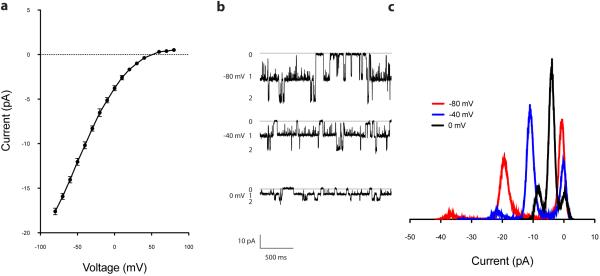
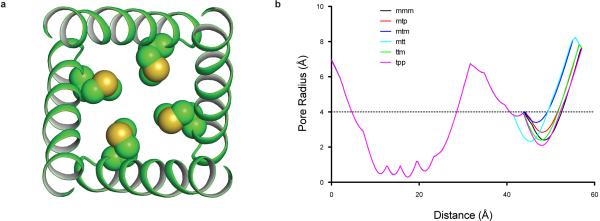
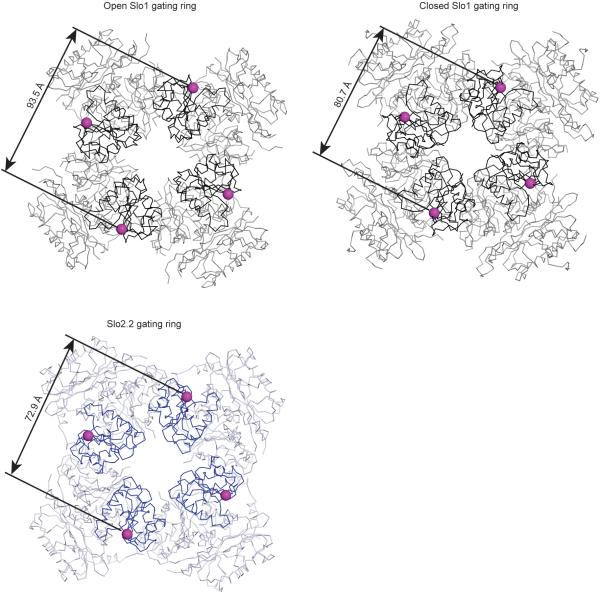
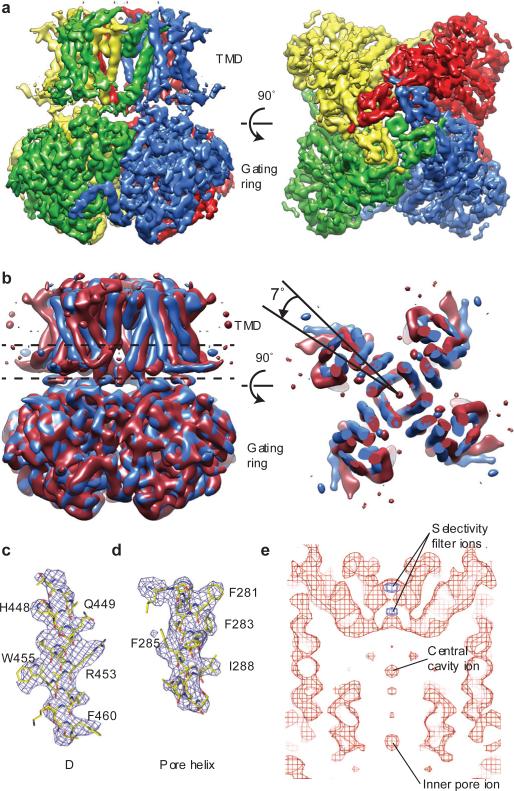
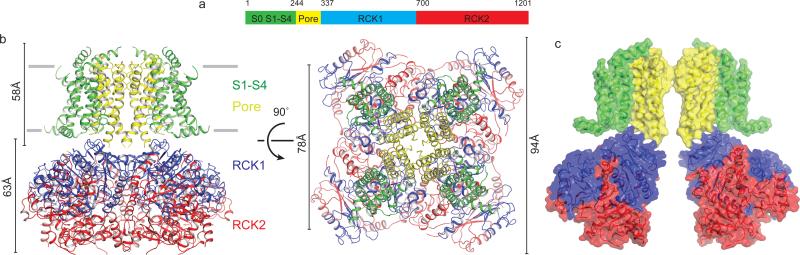
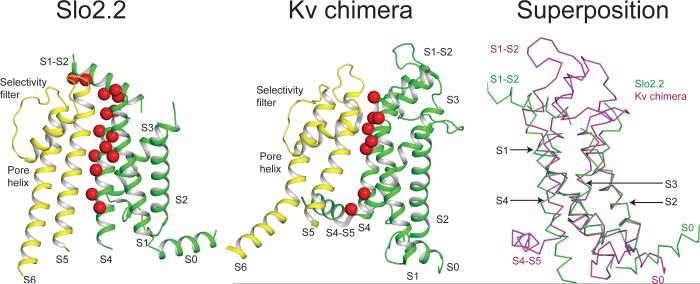
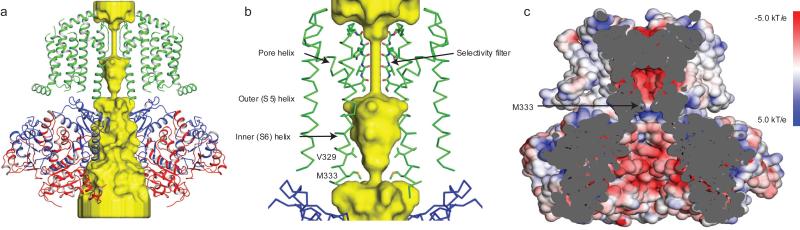
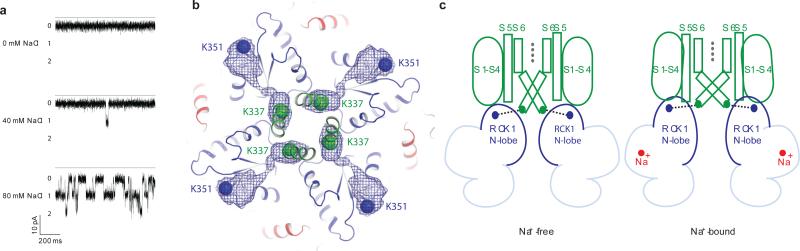
Na(+)-activated K(+) channels are members of the Slo family of large conductance K(+) channels that are widely expressed in the brain, where their opening regulates neuronal excitability. These channels fulfil a number of biological roles and have intriguing biophysical properties, including conductance levels that are ten times those of most other K(+) channels and gating sensitivity to intracellular Na(+). Here we present the structure of a complete Na(+)-activated K(+) channel, chicken Slo2.2, in the Na(+)-free state, determined by cryo-electron microscopy at a nominal resolution of 4.5 ångströms. The channel is composed of a large cytoplasmic gating ring, in which resides the Na(+)-binding site and a transmembrane domain that closely resembles voltage-gated K(+) channels. In the structure, the cytoplasmic domain adopts a closed conformation and the ion conduction pore is also closed. The structure reveals features that can explain the unusually high conductance of Slo channels and how contraction of the cytoplasmic gating ring closes the pore.


Figures

Extended Data Figure 1
Extended Data Figure 1. Sequence alignment of Slo channels
a, Sequence alignment of chicken Slo2.2 with human Slo2.2 and human Slo2.1. b, Predicted position of transmembrane helices in Slo2.2 S1-S4 domain based upon hydropothy analysis using Jpred 4. c-d, Structure-based sequence alignment of chicken Slo2.2 TMD with rat Kv chimera (c) and chicken Slo2.2 gating ring with human Slo1 gating ring (d). Helices are colored in blue and beta strands are colored in red.
Extended Data Figure 2
Extended Data Figure 2. Full channel 3D reconstruction of Chicken Slo2.2
a, Representative micrograph of detergent- and lipid-solubilized Slo2.2 in vitreous ice. b, 10 selected 2D class averages. c, Ab-initio initial model of Slo2.2. d, Fourier shell correlation (FSC) curve of the full channel reconstruction with the nominal resolution estimated to be 4.5 Å based on the FSC = 0.143 criterion.
Extended Data Figure 3
Extended Data Figure 3. Focused refinement of the gating ring and the TMD
a, 3D density map of the full channel reconstruction colored according to local resolution. b, 3D density map calculated following focused refinement using a mask to only include the gating ring colored according to local resolution. c, 3D density map calculated following focused refinement using a mask to only include the TMD colored according to local resolution. d, Fourier shell correlation of the full channel reconstruction (4.5 Å), the gating ring-focused refinement reconstruction (4.2 Å) and the TMD-focused refinement reconstruction (5.2 Å).
Extended Data Figure 4
Extended Data Figure 4. Validation of the Slo2.2 model
a, Refinement statistics for Slo2.2 full channel, TMD and gating ring models. b-c, FSC curves for cross-validation of the refined gating ring (b) and TMD (c) models. Black curve is the refined model compared to the full data set, red curve is the refined model compared to half map 1 (used during test refinement) and blue curve is the refined model compared to half map 2 (not used during test refinement).
Extended Data Figure 5
Extended Data Figure 5. K+ ions in Slo2.2
a, Central section of the density maps of the two independently calculated half maps with densities corresponding to K+ ions highlighted. b, Superposition of the Slo2.2 selectivity filter (green) with KcsA (PDB: 1K4C) selectivity filter (yellow). Density peaks resolved in Slo2.2 selectivity fitler at 6.5σ are shown as blue mesh. K+ ions resolved in KcsA are shown as grey spheres.
Extended Data Figure 6
Extended Data Figure 6. Representative segments of the cryo-EM density map
Selected regions of the gating ring density (a,b) and TMD density (c,d) maps with refined model.
Extended Data Figure 7
Extended Data Figure 7. Single channel conductance of Slo2.2
a, Single channel current-voltage relationship (mean ± s.e.m.) for Slo2.2 in planar lipid bilayers. Single channel conductance is ~200 pS. b, Representative recordings of Slo2.2 held at −80, −40 and 0 mV in planar lipid bilayers. Chamber solution contained 135 mM NaCl, 15 mM KCl and cup solution contained 150 mM KCl. c, Histogram of Slo2.2 currents when held at −80, −40 and 0 mV.
Extended Data Figure 8
Extended Data Figure 8. Inner helix gate
a, Ribbon diagram of the Slo2.2 pore with Met 333 side chains modeled as spheres. b, Pore radius plot for Slo2.2 with Met 333 modeled as each of the six most frequently observed rotamers.
Extended Data Figure 9
Extended Data Figure 9. Slo2.2 gating ring is in a closed conformation
Wire diagram of Slo1 gating ring in the open (top left) and closed (top right) conformations. The mobile RCK1 N-lobe is colored in black and the rest of the gating ring is colored in grey. The N-terminal residue of the gating ring, Lys 343, is shown as a sphere. Wire diagram of the Slo2.2 gating ring (bottom) with the RCK1 N-lobe colored in blue and the rest of the gating ring colored in white. The N-terminal residue of the gating ring, Lys 351, is shown as a sphere.
Figure 1
Figure 1. Cryo-EM structure of chicken Slo2.2
a, Cryo-EM density map of chicken Slo2.2 following focused refinements of the TMD and the gating ring. The gating ring map is filtered to 4.2 Å and the TMD map is filtered to 4.5 Å. b, Density map of two of the 3D subclasses filtered to 7 Å and aligned by their gating rings. The density slice corresponds to the region of the TMD between the dashed lines. c-d, Fragments of the density map corresponding to helix αC in the gating ring (c) and the pore helix in the TMD (d). The refined model is shown in sticks. Large side chains that were used to register the sequence are highlighted. e, Central section of the density map through the TMD calculated at 4σ (red) and 6.5σ (blue) with densities corresponding to K+ ions highlighted.
Figure 2
Figure 2. Architecture of Slo2.2
a, Domain organization of chicken Slo2.2. b, Ribbon diagram of Slo2.2. The S1-S4 domain is colored in green, the pore domain is colored in yellow, the RCK1 domain in blue and the RCK2 domain in red. The approximate width of the membrane is marked by the grey lines. c, Surface depiction of Slo2.2 with front and rear subunits removed for clarity.
Figure 3
Figure 3. Interactions between pore and S1-S4 domains
Ribbon diagram of Slo2.2 (left) S1-S4 domain and Kv chimera (middle) voltage-sensor domain colored in green with the pore domain colored in yellow. Red spheres represent the residues on S1, S4 and the S1-S2 linker that are close enough to interact with the pore domain. Superposition of the S1-S4 domain of Slo2.2 with the voltage-sensor domain of Kv chimera (right) by aligning S1, S2 and S3.
Figure 4
Figure 4. Slo2.2 ion conduction pathway
a, Surface representation of the Slo2.2 pore and ribbon diagram with front and rear subunits excluded for clarity. The K+- accessible surface was determined using the HOLLOW script (see methods section for details). b, The Slo2.2 constriction site is formed by Met 333 from the inner helix of each of the four subunits. c, Electrostatic surface potential of the Slo2.2 ion conduction pathway colored from red (−5.0 kT/e) to blue (5.0 kT/e).
Figure 5
Figure 5. Slo2.2 gating ring
Wire diagram of the Slo2.2 gating ring with the boundary of one subunit highlighted (left). The flexible interface that mediates interactions between the RCK1 and RCK2 domains of each subunit and the assembly interface that mediates interactions between adjacent subunits are shown. The assembly interface for Slo2.2 (middle) and Slo1 (right) with one subunit shown as a surface and the second shown as ribbons. The RCK1 domains are colored in blue and the RCK2 domains are colored in red. The Ca2+ ion resolved in the Slo1 Ca2+ bowl is shown as a yellow sphere.
Figure 6
Figure 6. Slo2.2 gating
a, Representative single channel recordings of Slo2.2 in planar lipid bilayers with symmetrical 0 - 80 mM NaCl and 150 mM KCl when held at −80 mV. b, Cryo-EM density connects Lys 337, the C-terminal residue of the TMD, to Lys 351, the N-terminal residue of the gating ring, the Cα positions of which are highlighted by spheres. The density is filtered to 5 Å. c, Model for Slo2.2 channel activation. Na+ binding to the gating ring results in an upward movement of the RCK1 N-lobes, which pull apart the inner S6 helices and push up the cytoplasmic ends of S4 and S5, thereby opening the pore.

Similar articles

Cited by

References

    1. Hille B. Ionic channels of excitable membranes. 2nd edn Sinauer Associates; 1992.
    1. Bader CR, Bernheim L, Bertrand D. Sodium-activated potassium current in cultured avian neurones. Nature. 1985;317:540–542. - PubMed
    1. Dryer SE, Fujii JT, Martin AR. A Na+-activated K+ current in cultured brain stem neurones from chicks. J Physiol. 1989;410:283–296. - PMC - PubMed
    1. Haimann C, Bader CR. Sodium-activated potassium channel in avian sensory neurons. Cell Biol Int Rep. 1989;13:1133–1139. - PubMed
    1. Kameyama M, et al. Intracellular Na+ activates a K+ channel in mammalian cardiac cells. Nature. 1984;309:354–356. - PubMed

References for Methods section

    1. Webster SM, Del Camino D, Dekker JP, Yellen G. Intracellular gate opening in Shaker K+ channels defined by high-affinity metal bridges. Nature. 2004;428:864–868. doi:10.1038/nature02468. - PubMed
    1. Mastronarde DN. Automated electron microscope tomography using robust prediction of specimen movements. J Struct Biol. 2005;152:36–51. doi:10.1016/j.jsb.2005.07.007. - PubMed
    1. Li X, et al. Electron counting and beam-induced motion correction enable near-atomic-resolution single-particle cryo-EM. Nat Methods. 2013;10:584–590. doi:10.1038/nmeth.2472. - PMC - PubMed
    1. Ludtke SJ, Baldwin PR, Chiu W. EMAN: semiautomated software for high-resolution single-particle reconstructions. J Struct Biol. 1999;128:82–97. doi:10.1006/jsbi.1999.4174. - PubMed
    1. Scheres SH. RELION: implementation of a Bayesian approach to cryo-EM structure determination. J Struct Biol. 2012;180:519–530. doi:10.1016/j.jsb.2012.09.006. - PMC - PubMed

Publication types