. 2016 Jan 5:419:60-71.
doi: 10.1016/j.mce.2015.09.034. Epub 2015 Oct 3.

Ca2+ influx through L-type Ca2+ channels and Ca2+-induced Ca2+ release regulate cAMP accumulation and Epac1-dependent ERK 1/2 activation in INS-1 cells

Affiliations

Ca2+ influx through L-type Ca2+ channels and Ca2+-induced Ca2+ release regulate cAMP accumulation and Epac1-dependent ERK 1/2 activation in INS-1 cells

Evan P S Pratt et al. Mol Cell Endocrinol. .

Abstract

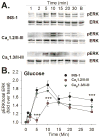
We previously reported that INS-1 cells expressing the intracellular II-III loop of the L-type Ca(2+) channel Cav1.2 (Cav1.2/II-III cells) are deficient in Ca(2+)-induced Ca(2+) release (CICR). Here we show that glucose-stimulated ERK 1/2 phosphorylation (GSEP) is slowed and reduced in Cav1.2/II-III cells compared to INS-1 cells. This parallels a decrease in glucose-stimulated cAMP accumulation (GS-cAMP) in Cav1.2/II-III cells. Influx of Ca(2+) via L-type Ca(2+) channels and CICR play roles in both GSEP and GS-cAMP in INS-1 cells since both are inhibited by nicardipine or ryanodine. Further, the Epac1-selective inhibitor CE3F4 abolishes glucose-stimulated ERK activation in INS-1 cells, as measured using the FRET-based sensor EKAR. The non-selective Epac antagonist ESI-09 but not the Epac2-selective antagonist ESI-05 nor the PKA antagonist Rp-cAMPs inhibits GSEP in both INS-1 and Cav1.2/II-III cells. We conclude that L-type Ca(2+) channel-dependent cAMP accumulation, that's amplified by CICR, activates Epac1 and drives GSEP in INS-1 cells.

Keywords: Ca(2+)-induced Ca(2+) release; Ca(v)1.2; Exchange protein directly activated by cAMP; Extracellular signal regulated kinase 1/2; L-type Ca(2+) channel; Pancreatic beta-cell; cAMP.


Figures

Figure 1
Figure 1. Time course of GSEP in control INS-1 cells and Cav1.2/II-III cells
A) INS- cells, Ca1.2/II-III cells or Cav1.3/II-III cells were stimulated with 18 mM glucose for the indicated times. The far right lane shows the basal (B) level of pERK the absence of glucose stimulation. Total ERK and phosphorylated ERK (pERK) were detected by western blotting. Western blots shown are representative of at least three separate experiments. B) INS-1 cells, Cav1.2/II-III cells, and Cav1.3/II-III cells were stimulated with glucose (18 mM) for the indicated times shown on the x-axis. Total ERK and pERK were detected and quantified using a cell-based ELISA. The ratio of pERK to total ERK was determined at each time point and normalized to pERK/total ERK prior to glucose stimulation (0 min). GSEP was significantly reduced in Cav1.2/II-III cells compared to control INS-1 cells at the 5, 10, and 30 min time points (***, P < 0.001 One Way ANOVA, Holm-Sidak post-hoc test). In contrast, GSEP was not different between INS-1 cells and Cav1.3/II-III cells at any time point. Data shown are the mean ± SE of at least three independent experiments.
Figure 2
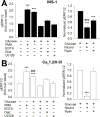
Figure 2. Role of Ca2+ in GSEP in INS-1 and Cav1.2/II-III cells
ERK phosphorylation was measured using a cell-based ELISA as described in Materials and Methods. A) Left panel- INS-1 cells were stimulated with 18 mM glucose for 10 min in the presence or absence of the indicated agents. pERK/total ERK was determined for each treatment condition and normalized to the basal ratio. GSEP was not different compared to ERK phosphorylation stimulated by 1 μM PMA. Glucose did not significantly stimulate ERK phosphorylation above basal levels in the absence of extracellular Ca2+ (10 mM EGTA), in the absence of membrane depolarization (300 μM diazoxide), or in the presence of the MEK inhibitor U-0126 (10 μM) (***, P < 0.001 compared to basal; One-Way ANOVA, Holm-Sidak post-hoc test). Right panel- INS-1 cells were stimulated with 18 mM glucose alone for 10 min or in the presence of nicardipine (2 μM) or ryanodine (20 μM). pERK/total ERK was determined for each treatment condition and normalized to the ratio in the presence of glucose alone. GSEP was significantly inhibited by 2 μM nicardipine (L-type channel blocker) and 20 μM ryanodine (inhibitor of CICR). Nicardipine inhibited a significantly greater fraction of GSEP than ryanodine (***, P < 0.001 compared to glucose alone; ###, P < 0.001 compared to ryanodine; One-Way ANOVA, Holm- Sidak post-hoc test). B) Left panel- Cav1.2/II-III cells were stimulated as in A, in the absence or presence of the indicated agents, and pERK/total ERK was determined for each condition and normalized to basal. GSEP was significantly less than that stimulated by PMA in Cav1.2/II-III cells. Glucose did not significantly stimulate ERK phosphorylation above basal levels in the presence of 10 mM EGTA, 300 μM diazoxide, or 10 μM U0126 in Cav1.2/II-III cells (***, P < 0.001 compared to basal; ###, P < 0.001 compared to PMA; One-Way ANOVA, Holm-Sidak post-hoc test). Right panel- Cav1.2/II-III cells were stimulated with 18 mM glucose alone for 10 min or in the presence of nicardipine (2 μM) or ryanodine (20 μM). pERK/total ERK was determined for each treatment condition and normalized to the ratio in the presence of glucose alone. GSEP was significantly inhibited by 2 μM nicardipine but not 20 μM ryanodine in Cav1.2/II-III cells (***, P < 0.001 compared to glucose alone; One-Way ANOVA, Holm-Sidak post-hoc test). All data are shown as mean ± SE from at least three independent experiments.
Figure 3
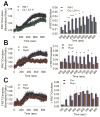
Figure 3. Glucose-stimulated ERK activation is delayed and independent of CICR in Cav1.2/II-III cells
A) Left panel- Averaged ratiometric (FRET/Cerulean) traces of EKAR expressed in INS-1 cells (blue circles) and Cav1.2/II-III cells (green circles). Cells were stimulated with glucose (18 mM) at 60 sec. Right panel- The change in FRET/Cerulean ratio from baseline in control INS-1 cells (blue bars) is significantly greater than in Cav1.2/II-III cells (green bars) at several time points (***, P < 0.001, **,P < 0.01,*, P < 0.05, Student’s unpaired t-test). The INS-1 cell trace is the average of 24 independent experiments (535 total cells), and the Cav1.2/II-III is the average of 13 independent experiments (338 total cells). B) Left panel- Averaged ratiometric (FRET/Cerulean) traces of EKAR expressed in INS-1 cells stimulated with glucose (18 mM) at 60 sec in the presence (red circles) or absence (blue circles) of ryanodine (20 μM). Right panel- The change in FRET/Cerulean ratio from baseline after glucose stimulation is significantly less in the ryanodine-treated group (red bars) compared to untreated (blue bars) at several time points (*, P < 0.05, Student’s unpaired t-test). Both traces are the average of 5 independent experiments (control: 120 total cells, ryanodine: 97 total cells). C) Left panel- Averaged ratiometric (FRET/Cerulean) traces of EKAR expressed in Cav1.2/II-III cells stimulated with glucose (18 mM) at 60 sec in the presence (red circles) or absence (blue circles) of ryanodine (20 μM). Right panel- The change in FRET/Cerulean ratio from baseline in Cav1.2/II-III cells is not different between ryanodine-treated (red bars) and untreated (blue bars). Significance was determined using Student’s unpaired t-test, with P < 0.05 considered significant. Both traces are the average of 3 independent experiments (control: 68 total cells, ryanodine: 76 total cells).
Figure 4
Figure 4. GS-cAMP is absent in Cav1.2/II-III cells
A) Left panel- Ratiometric (mTurquoise2/FRET) traces of H187 expressed in INS-1 (blue circles) and Cav1.2/II-III cells (green circles) stimulated with forskolin (25 μM) + IBMX (100 μM) at the 60 sec time point. Right Panel- The change in mTurquoise2/FRET ratio from baseline is not different between control INS-1 cells (blue bars) and Cav1.2/II-III cells (green bars). Significance was determined using Student’s unpaired t-test, with P < 0.05 considered significant. The INS-1 trace is the average of 5 independent experiments (83 total cells), and the Cav1.2/II-III is the average of 6 independent experiments (113 total cells). B) Left Panel- Ratiometric (mTurquoise2/FRET) traces of H187 expressed in INS-1 (blue circles) and Cav1.2/II-III cells (green circles) stimulated with glucose (18 mM) at the 60 sec time point. Right Panel- The change in mTurquoise2/FRET ratio from baseline after glucose stimulation is significantly greater in control INS-1 cells (blue bars) than Cav1.2/II-III cells (green bars) at several time points (*, P < 0.05, Student’s unpaired t-test) The INS-1 cell trace is the average of 13 independent experiments (240 total cells), and the Cav1.2/II-III is the average of 8 independent experiments (156 total cells).
Figure 5
Figure 5. GS-cAMP is regulated by CICR in INS-1 cells
A) Left panel- Averaged ratiometric (mTurquoise2/FRET) traces of H187 expressed in INS-1 cells stimulated with glucose (18 mM) at 60 sec in the presence (green circles) or absence (blue circles) of nicardipine (2 μM). Right panel- The change in FRET/Cerulean ratio from baseline after glucose stimulation is significantly less in the nicardipine-treated (green bars) compared to untreated (blue bars) at several time points (**,P < 0.01,*, P < 0.05, Student’s unpaired t-test). Both traces are the average of 5 independent experiments (control: 86 total cells, nicardipine: 117 total cells). B) Left panel- Averaged ratiometric (mTurquoise2/FRET) traces of H187 expressed in INS-1 cells stimulated with glucose (18 mM) at 60 sec in the presence (green circles) or absence (blue circles) of ryanodine (20 μM). Right panel- The change in FRET/Cerulean ratio from baseline after glucose stimulation is significantly less in the ryanodine-treated group (green bars) compared to untreated (blue bars) at several time points (*,P < 0.05, Student’s unpaired t-test). Both traces are the average of 4 independent experiments (control: 73 total cells, ryanodine: 78 total cells).
Figure 6
Figure 6. Role of cAMP in GSEP in INS-1 cells
ERK phosphorylation was measured using a cell-based ELISA as described in Materials and Methods. A) Control INS-1 cells were stimulated with 18 mM glucose for 10 min in the presence or absence of the indicated agents. pERK/total ERK was determined for each treatment condition and normalized to pERK/total ERK in the presence of glucose alone. Nicardipine (2 μM) significantly inhibited GSEP. The PKA inhibitor Rp-cAMPS (100 μM) significantly enhanced GSEP, but the combination of nicardipine and Rp-cAMPS inhibited GSEP to a significantly greater extent than nicardipine alone. The Epac2-selective inhibitor ESI-05 (10 μM) didn’t significantly inhibit GSEP. The non-selective Epac inhibitor ESI-09 (10 μM) significantly inhibited GSEP. Combination of ESI-09 with either nicardipine or Rp-cAMPS didn’t inhibit GSEP to a significantly greater extent than ESI-09 alone (***, P < 0.001, **, P < 0.01 compared to glucose alone; ###, P < 0.001 compared to glucose + nicardipine; One-Way ANOVA, Holm-Sidak post-hoc test). Data shown are means ± SE of at least 3 independent experiments. B) INS-1 cells were stimulated with ESCA (10 μM) or GLP-1 (50 nM) for 2 min. pERK/total ERK was determined and normalized to the basal ratio. ERK phosphorylation was significantly stimulated by ESCA or GLP-1 in the absence of glucose. The ERK phosphorylation stimulated by GLP-1 was significantly greater than that stimulated by ESCA (***, P < 0.001;**, P < 0.01 compared to basal; ##, P < 0.01 compared to GLP-1, One-Way ANOVA, Holm-Sidak post-hoc test). Data shown are means ± SE of at least 3 independent experiments.
Figure 7
Figure 7. Inhibition of Epac1 but not Epac2 diminishes glucose-stimulated ERK activation in INS-1 cells
A) Left panel- Averaged ratiometric (FRET/Cerulean) traces of EKAR expressed in INS-1 cells stimulated with glucose (18 mM) at 60 sec in the presence (green circles) or absence (blue circles) of the Epac1-selective inhibitor CE3F4 (20 μM). Right panel- The change in FRET/Cerulean ratio from baseline after glucose stimulation is significantly less in the CE3F4-treated group (green bars) compared to untreated (blue bars) at several time points (*, P < 0.05, Student’s unpaired t-test). Both traces are the average of 3 independent experiments (control: 63 total cells, CE3F4: 44 total cells). B) Left panel- Averaged ratiometric (FRET/Cerulean) traces of EKAR expressed in INS-1 cells stimulated with glucose (18 mM) at 60 sec in the presence (green circles) or absence (blue circles) of the Epac2-selective inhibitor ESI-05 (10 μM). Right panel- The change in FRET/Cerulean ratio from baseline after glucose stimulation is not different between ESI-05-treated (green bars) and untreated (blue bars). Significance was determined using Student’s unpaired t-test, with P < 0.05 considered significant. Both traces are the average of 3 independent experiments (control: 111 total cells, ESI-05: 111 total cells).
Figure 8
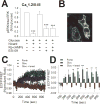
Figure 8. Plasma membrane-localized accumulation of cAMP in response to glucose in Cav1.2/II-III cells
A) Cav1.2/II-III cells were stimulated with 18 mM glucose for 10 min in the presence or absence of the indicated agents. Using cell-based ELISA, pERK/total ERK was determined for each treatment condition and normalized to pERK/total ERK in the presence of glucose alone. The L-type Ca2+ channel blocker nicardipine (2 μM) and the non-selective Epac inhibitor ESI-09 (10 μM) both significantly inhibited GSEP. The combination of nicardipine and ESI-09 didn’t inhibit GSEP to a significantly greater extent than either agent alone. In contrast, the PKA inhibitor Rp-cAMPS (100 μM) did not significantly inhibit GSEP in Cav1.2/II-III cells (***, P < 0.001, **, P < 0.01 compared to glucose alone, One-Way ANOVA, Holm-Sidak post-hoc test). Data shown are means ± SE of at least 3 independent experiments. B) 60x magnification image of the Epac-MyrPalm sensor expressed in INS-1 cells. Note the specific localization of the probe to the plasma membrane. C) Averaged ratiometric (ECFP/FRET) traces of Epac-MyrPalm expressed in Cav1.2/II-III cells. Cells were stimulated at 60 sec with 25 μM forskolin + 100 μM IBMX (green circles) or 18 mM glucose in the presence (red circles) or absence (blue circles) of the L-type Ca2+ channel blocker isradipine (2 μM). D) The change in the ECFP/ FRET ratio from baseline after stimulation with forskolin + IBMX or glucose is significantly greater than glucose + isradipine at several time points (***,P < 0.001, **, P < 0.01,*, P < 0.05 compared to glucose + isradipine; One-Way ANOVA, Holm-Sidak post-hoc test). The traces showing stimulation with forskolin + IBMX or glucose alone are the average of 5 independent experiments (forskolin: 124 total cells, glucose: 137 total cells), and the trace showing glucose + isradipine is the average of 4 independent experiments (95 total cells).
Figure 9
Figure 9. Model for the activation of ERK by glucose in INS-1 cells
In control INS-1 cells, glucose stimulates membrane depolarization and activation of Cav1.2. Ca2+ influx via Cav1.2 can directly stimulate adenylyl cyclase activity (presumably AC8; (Delmeire et al., 2003), but cAMP accumulation is amplified by CICR from the ER. Epac1 is subsequently activated by cAMP accumulation, leading to the activation of the Rap1/B-Raf/MEK pathway, and phosphorylation of ERK. In Cav1.2/II-III cells, Cav1.2 is no longer efficiently coupled to CICR, and cAMP accumulation is mediated solely by Ca2+ influx across the plasma membrane via Cav1.2. In the face of reduced cAMP accumulation, ERK activation is delayed and reduced compared to control INS-1 cells.

Similar articles

Cited by

References

    1. Agarwal SR, Yang PC, Rice M, Singer CA, Nikolaev VO, Lohse MJ, Clancy CE, Harvey RD. Role of membrane microdomains in compartmentation of cAMP signaling. PloS one. 2014;9(4):e95835. - PMC - PubMed
    1. Arnette D, Gibson TB, Lawrence MC, January B, Khoo S, McGlynn K, Vanderbilt CA, Cobb MH. Regulation of ERK1 and ERK2 by glucose and peptide hormones in pancreatic beta cells. J Biol Chem. 2003;278(35):32517–32525. - PubMed
    1. Asfari M, Janjic D, Meda P, Li G, Halban PA, Wollheim CB. Establishment of 2-mercaptoethanol-dependent differentiated insulin-secreting cell lines. Endocrinology. 1992;130(1):167–178. - PubMed
    1. Bashan N, Dorfman K, Tarnovscki T, Harman-Boehm I, Liberty IF, Bluher M, Ovadia S, Maymon-Zilberstein T, Potashnik R, Stumvoll M, Avinoach E, Rudich A. Mitogen-activated protein kinases, inhibitory-kappaB kinase, and insulin signaling in human omental versus subcutaneous adipose tissue in obesity. Endocrinology. 2007;148(6):2955–2962. - PubMed
    1. Bouzakri K, Roques M, Gual P, Espinosa S, Guebre-Egziabher F, Riou JP, Laville M, Le Marchand-Brustel Y, Tanti JF, Vidal H. Reduced activation of phosphatidylinositol-3 kinase and increased serine 636 phosphorylation of insulin receptor substrate-1 in primary culture of skeletal muscle cells from patients with type 2 diabetes. Diabetes. 2003;52(6):1319–1325. - PubMed

Publication types

MeSH terms

LinkOut - more resources