. 2015 Nov 15;195(10):4922-32.
doi: 10.4049/jimmunol.1500163. Epub 2015 Oct 2.

Novel Role of TRPML2 in the Regulation of the Innate Immune Response

Affiliations

Novel Role of TRPML2 in the Regulation of the Innate Immune Response

Lu Sun et al. J Immunol. .

Abstract

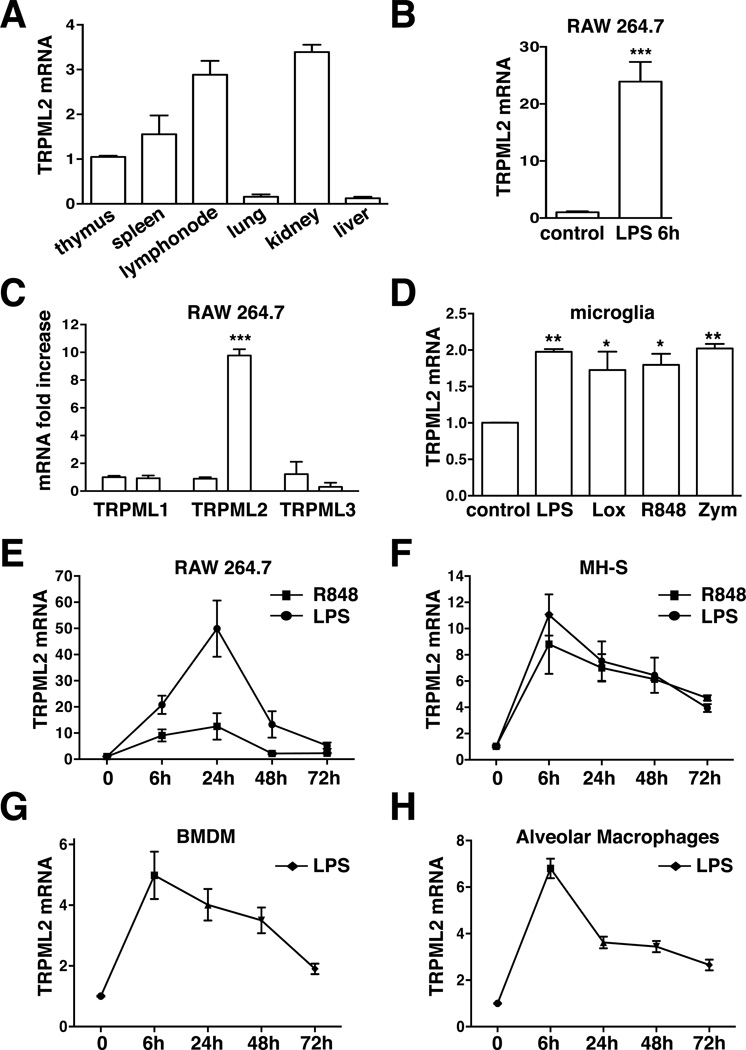
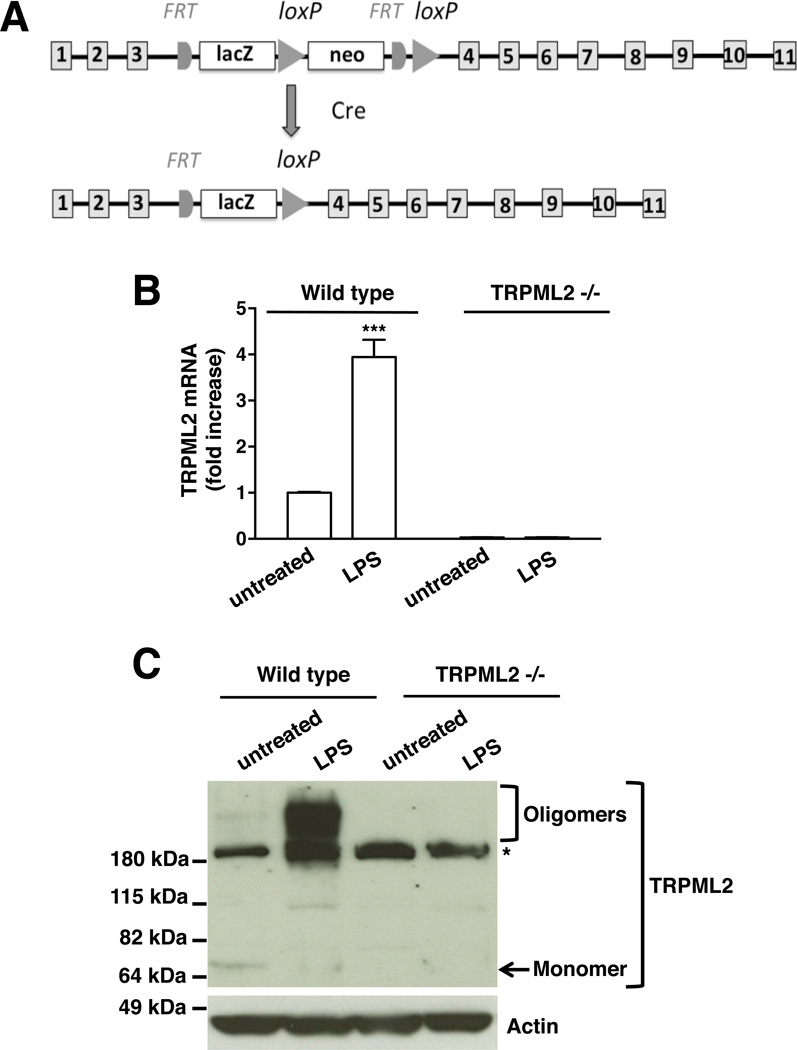
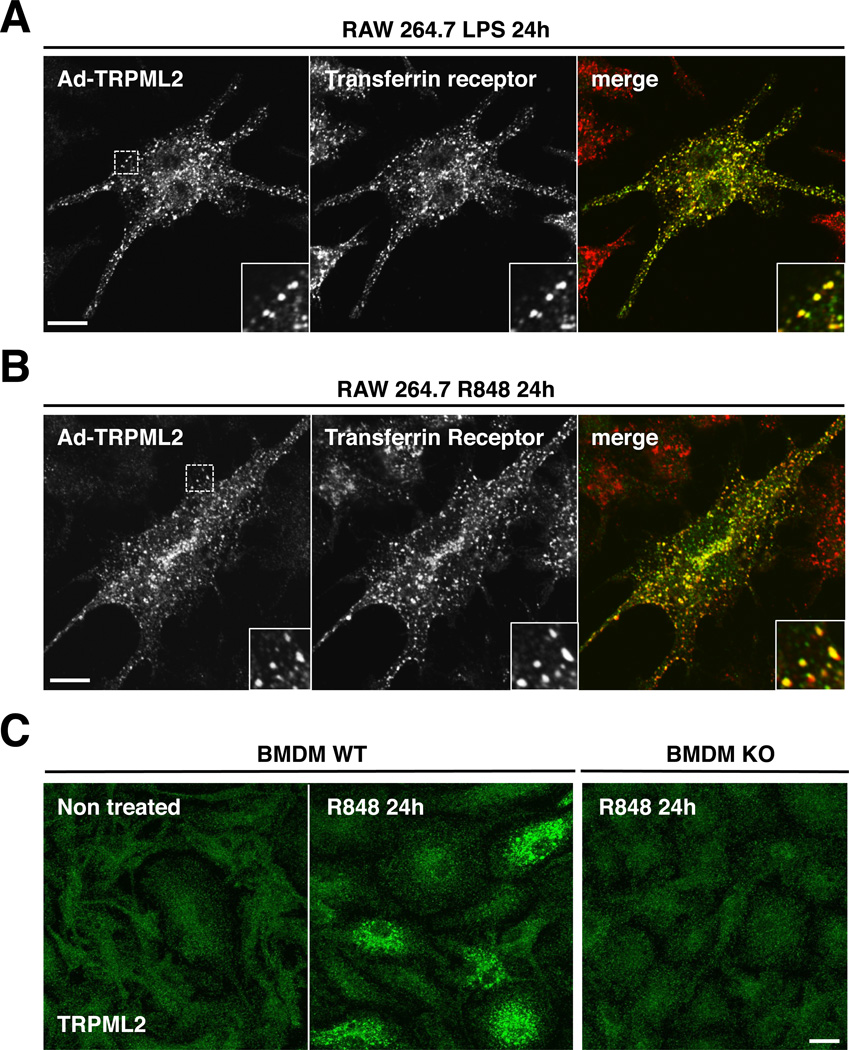
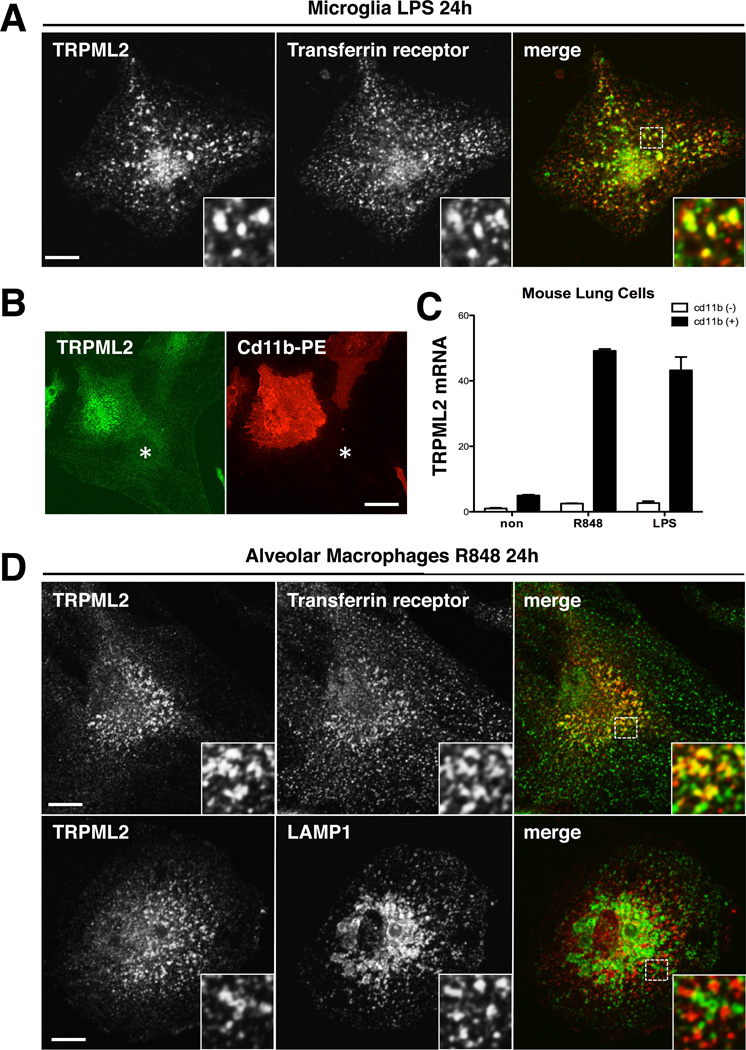
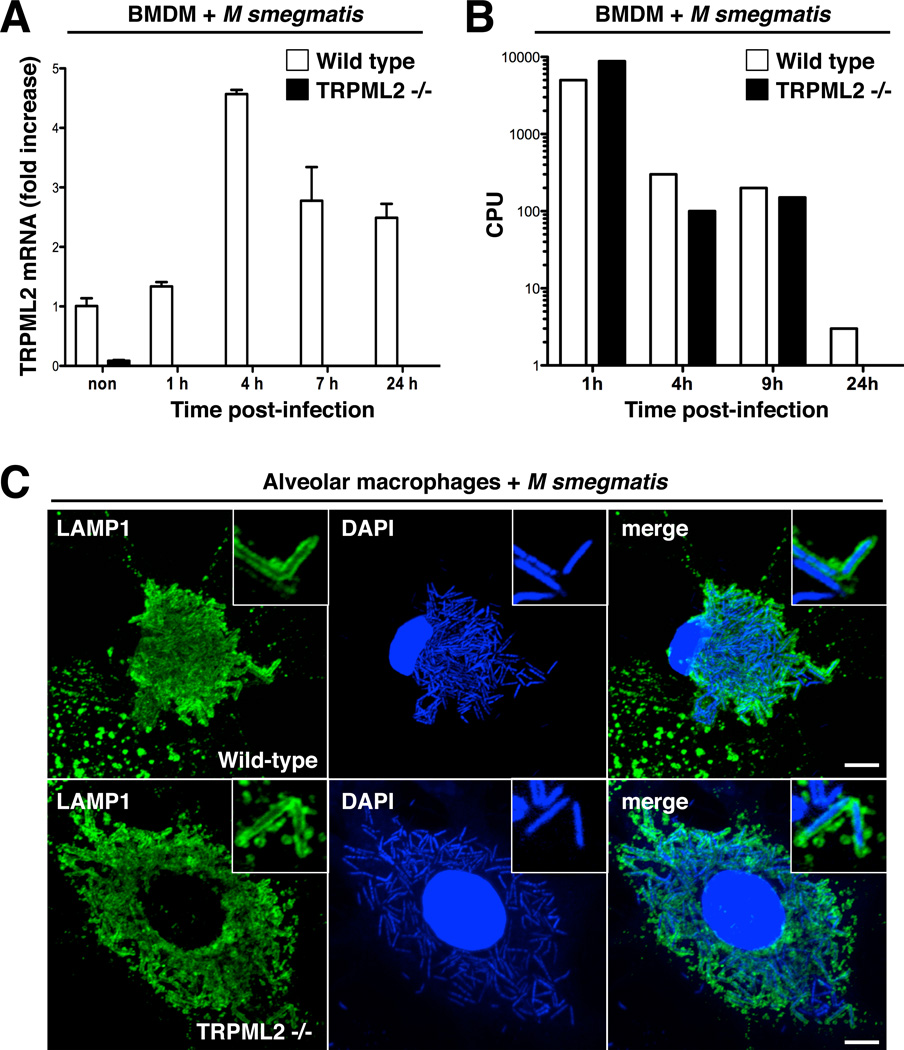
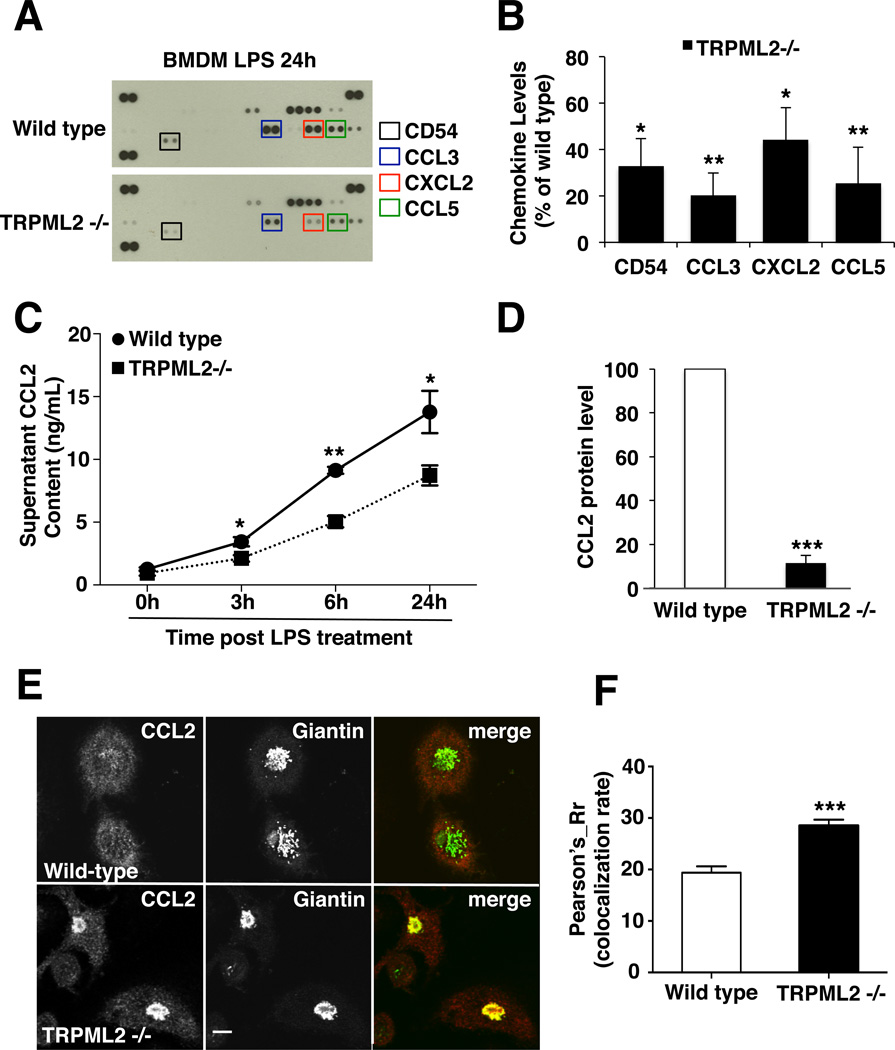
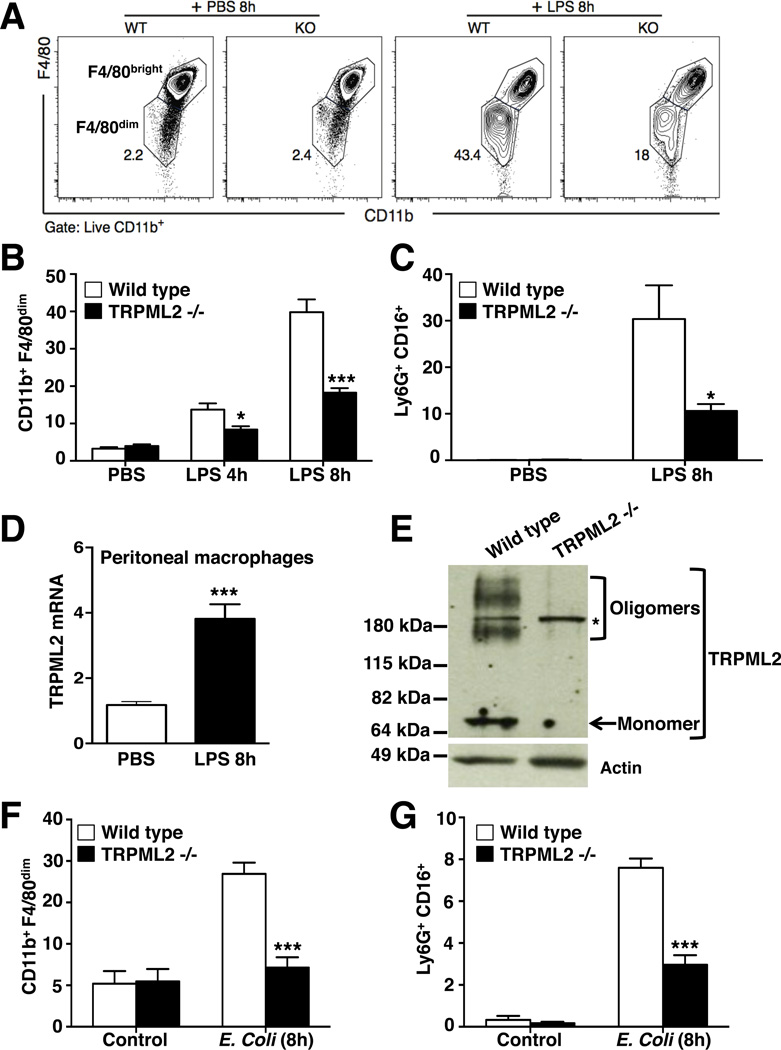
TRPMLs (or mucolipins) constitute a family of endosomal cation channels with homology to the transient receptor potential superfamily. In mammals, the TRPML family includes three members: TRPML1-3. Although TRPML1 and TRPML3 have been well characterized, the cellular function of TRPML2 has remained elusive. To address TRPML2 function in a physiologically relevant cell type, we first analyzed TRPML2 expression in different mouse tissues and organs and found that it was predominantly expressed in lymphoid organs and kidney. Quantitative RT-PCR revealed tight regulation of TRPML2 at the transcriptional level. Although TRPML2 expression was negligible in resting macrophages, TRPML2 mRNA and protein levels dramatically increased in response to TLR activation both in vitro and in vivo. Conversely, TRPML1 and TRPML3 levels did not change upon TLR activation. Immunofluorescence analysis demonstrated that endogenous TRPML2 primarily localized to recycling endosomes both in culture and primary cells, in contrast with TRPML1 and TRPML3, which distribute to the late and early endosomal pathway, respectively. To better understand the in vivo function of TRPML2, we generated a TRPML2-knockout mouse. We found that the production of several chemokines, in particular CCL2, was severely reduced in TRPML2-knockout mice. Furthermore, TRPML2-knockout mice displayed impaired recruitment of peripheral macrophages in response to i.p. injections of LPS or live bacteria, suggesting a potential defect in the immune response. Overall, our study reveals interesting differences in the regulation and distribution of the members of the TRPML family and identifies a novel role for TRPML2 in the innate immune response.


Conflict of interest statement

Conflict of interest

The authors declare no competing financial interests.

Figures

Figure 1
Figure 1. TRPML2 is transcriptionally up-regulated in activated macrophages
A. Measurement of TRPML2 mRNA levels from different C57BL/6N mice organs by quantitative RT-qPCR. TRPML2 mRNA levels were normalized to TRPML2 levels in thymus and represent fold change. Data are presented as means ± SD of four (thymus, liver) or three (spleen, lymphonode, lung, kidney) independent experiments. B and C. RAW 264.7 cells were left untreated or incubated with 1µg/ml LPS for 6 hours. Cells were then collected and TRPML2 (B) or TRPML1-3 (C) mRNA levels were measured by RT-qPCR (n=20, ***P< 0.0001). D. Transcriptional up-regulation of TRPML2 in microglia in response to various TLR activators. Cultured microglia cells were treated with the following reagents for 6 hours: LPS (1 µg/ml, TLR4 ligand), Loxoribine (100 nM, TLR7 ligand), R848 (200 ng/ml, TLR7 and TLR8 ligand), and ZymosanA (50 µg/ml, TLR2 ligand). Data are presented as means ± SD of three independent experiments (*P ≤ 0.05, **P ≤ 0.01). E, F. TRPML2 mRNA levels time course upon LPS and R848 stimulation for 6 hours in RAW 264.7 (n=14) and MH-S (n=9) cells. G, H. TRPML2 mRNA levels time course in cultured primary macrophages. Data is presented as mRNA fold change for in bone marrow derived macrophages (n=6) and alveolar macrophages (n=5) 6 hours after LPS treatment.
Figure 2
Figure 2. Generation of TRPML2− / − knockout mice
A. Schematic representation of Cre-loxP mediated deletion of TRPML2. The ‘knockout-first’ allele contains a trapping cassette with a lacZ reporter and a floxed promoter-driven neo cassette inserted into the intron of the MCOLN2 gene thereby disrupting gene function. By crossing with the EIIA-Cre mouse, the neo cassette between two LoxP sites was deleted. B. BMDM extracted from wild type and TRPML2 knockout (KO) mice (n=9) were left untreated or incubated with LPS (1 µg/ml) for 6 hours. TRPML2 mRNA levels from all groups were normalized to the WT untreated samples. Data is presented as mRNA fold change for four independent experiments (***P < 0.0001). C. Primary bone marrow macrophages from WT and KO mice were left untreated or treated with LPS (1 µg/ml) for 24 hours. TRPML2 protein levels were assessed by western blotting using rabbit anti-TRPML2 antibody. The results shown are representative of three independent experiments. The predicted molecular weight for TRPML2 is approximately 65 kDa (arrow). TRPML2 oligomers run above the 180 kDA marker. The asterisk indicates an unspecific band recognized by our antibody. Actin (42 kDa) was used as a loading control.
Figure 3
Figure 3. Intracellular distribution of TRPML2 in RAW 264.7 and BMDM
A, B. RAW 264.7 cells were infected with Ad-TRPML2 and stimulated with LPS (1 µg/ml) or R848 (200 ng/ml) for 24 hours. Cells were permeabilized and immunostained with TRPML2 and transferrin receptor (TfR) antibodies and analyzed by confocal fluorescence microscopy. Yellow indicates colocalization between TRPML2 (green) and TfR (red). Insets show a 4-fold magnification of the indicated region. Scale bars, 10 µm. Images are representative of three independent experiments. C. WT and TRPML2 KO BMDM were treated with R848 for 24 hours. Endogenous TRPML2 expression was assessed using our TRPML2 antibody. Scale bars, 10 µm. Images are representative of three independent experiments.
Figure 4
Figure 4. Endogenous TRPML2 localizes to recycling endosomes in activated microglia and alveolar macrophages
A. LPS increases TRPML2 protein levels in primary mouse microglia. Primary microglia cells isolated from wild type mice were treated with LPS (1 µg/ml) for 24 hours. Cells were permeabilized and immunostained with TRPML2 (green) and TfR (red) antibodies. Insets show a 4-fold magnification of the indicated region. Scale bars, 10 µm. Images are representative of three independent experiments B. Cultured primary lung cells were stimulated with R848 (200 ng/ml) for 24 hours. TRPML2 expression was detected in alveolar macrophages (CD11b+) but not in fibroblasts (*). C. Cultured lung cells were treated with R848 (200 ng/ml) or LPS (1 µg/ml) for 10 hours and sorted based on CD11b level. D. Alveolar macrophages were treated with R848 (200 ng/ml) for 24 hours and immunostained with TRPML2 (red) and TfR or LAMP1 (green) antibodies. Yellow indicates colocalization between TRPML2 and TfR (top) or TRPML2 and LAMP1 (bottom). Insets show a 4-fold magnification of the indicated region. Scale bars, 10 µm. Images are representative of three independent experiments.
Figure 5
Figure 5. M. Smegmatis degradation in alveolar macrophages does not require TRPML2
A. M. Smegmatis infection induced TRPML2 mRNA levels in BMDM derived from wild type mice. Equal number of macrophages from WT and TRPML2 KO mice were plated and infected with same amount of M. smegmatis. Cells were collected at indicated time points and TRPML2 mRNA was measured by RT-PCR. B. The efficiency of WT and TRPML2 KO BMDM to eliminate engulfed M. smegmatis was measured as Colony Forming Unit (CFU). Cultured BMDM were infected with M. smegmatis at a 1 to 100 ratio (MOI 100). Infected macrophages were lysed at indicated time points. Cell lysates were resuspended in 800ul of LB broth and subjected to serial dilution. Ten microliters of each dilution were plated on LB agar plates. After overnight incubation, the numbers of bacterial colonies were counted. C. Infected alveolar macrophages were fixed and stained with LAMP1 antibody (green) and DAPI (blue). The inset shows tubular lysosome surrounding M. smegmatis in both WT and KO macrophages. Insets show a 4-fold magnification of the indicated region. Scale bars, 5 µm. Images are representative of three independent experiments.
Figure 6
Figure 6. Chemokine secretion is reduced in TRPML2 knockout mice
A. BMDM from WT and TRPML2 KO mice were treated with LPS for 24 hours. Cell lysates were extracted and analyzed using the Proteome Profiler Mouse Cytokine Array from R&D Systems. Blots are representative of three independent experiments. B. Spot intensities from the blots in A were quantified using ImageJ. Data are presented as the mean percent change of lysate cytokine levels in TRPML2 KO compared to WT ± SEM of three independent experiments. The data were analyzed using Student’s t-test (*P ≤ 0.01, **P ≤ 0.001). C. BMDM from WT and TRPML2 KO mice were treated with LPS for the indicated times. The CCL2 content in cell supernatants was analyzed by ELISA. Data is presented as mean ± SEM of five independent experiments. The data were analyzed using Student’s t-test (*P ≤ 0.05, **P ≤ 0.005). D. BMDM from WT and TRPML2 KO mice were treated with LPS for 24 hours. The cytokine content in culture supernatants was analyzed as in A. Data is presented as the mean percent change of serum cytokine levels in TRPML2 KO compared to WT ± SEM of three independent experiments. The data were analyzed using Student’s t-test (***P ≤ 0.0005). E. BMDM cells isolated from wild type and TRPML2 KO mice were treated with LPS (1 µg/ml) for 24 hours. Cells were permeabilized and immunostained with CCL2 (red) and Giantin (green) antibodies. Scale bars, 10 µm. Images are representative of three independent experiments. F. Co-localization between CCL2 and Giantin in LPS-treated wild-type (n=154) and TRPML2− / − (n=169) BMDM was quantified by Pearson’s coefficient (***P ≤ 0.005).
Figure 7
Figure 7. Macrophage migration is impaired in TRPML2 knockout mice
A. Flow cytometric analysis of CD11b+F4/80bright (indicative of resident macrophages) and CD11b+F4/80dim (indicative of recruited macrophages) peritoneal macrophages isolated from peritoneal fluid of WT and TRPML2 KO mice injected with saline or LPS for 8 hours. Numbers represent the CD11b+F4/80dim percentage of CD11b positive cells. B. Graphical representation of percentage of CD11b+F4/80dim cells from WT (white) and TRPML2 KO (black) mice injected with saline or LPS (0.5 µg/g) for 4 hours or 8 hours. Data are presented as means ± SD of at least three independent experiments (LPS 4h: n=4, LPS 8h: n=16, saline: n=11). The data were analyzed using two-way ANOVA (*P (LPS 4h)<0.05, ***P(LPS 8h)<0.0005). C. Graphical representation of percentage of neutrophils (Ly6G+CD16+ cells) from WT (white) and TRPML2 KO (black) mice injected with saline or LPS (0.5 µg/g) for 8 hours. Data are presented as means ± SD of three independent experiments (LPS 8h: n=7, saline: n=5). The data were analyzed using two-way ANOVA (*P<0.05). D. TRPML2 mRNA levels from peritoneal macrophages isolated from WT mice that were injected with saline or LPS. Statistical significance was determined by two-tailed unpaired Student’s t test. Error bars represent SEM (n=13 for LPS group and n=7 for saline group, ***P< 0.0001). E. TRPML2 protein levels in peritoneal macrophages extracted from WT and KO mouse were assessed by western blot. The predicted molecular weight for TRPML2 is approximately 65 kDa (arrow). TRPML2 oligomers run above the 180 kDA marker. The asterisk indicates an unspecific band recognized by our antibody. Actin (42 kDa) was used as a loading control. The shown image is a representative from three independent experiments. F. Graphical representation of percentage of CD11b+F4/80dim cells from WT (white) and TRPML2 KO (black) mice injected with saline or live enterotoxigenic Escherichia coli (strain H10407) (5 × 10⁷ CFUs) for 8 hours. Data are presented as means ± SD of two independent experiments (E coli: n=5, saline: n=3). The data were analyzed using two-way ANOVA (***P<0.0005). G. Graphical representation of percentage of Ly6G+CD16+ cells from WT (white) and TRPML2 KO (black) mice injected with saline or live enterotoxigenic Escherichia coli (strain H10407) (5 × 10⁷ CFUs) for 8 hours. Data are presented as means ± SD of two independent experiments (E coli: n=5, saline: n=3). The data were analyzed using two-way ANOVA (***P<0.0005).

Similar articles

Cited by

References

    1. Abe K, Puertollano R. Role of TRP channels in the regulation of the endosomal pathway. Physiology. 2011;26:14–22. - PMC - PubMed
    1. Venkatachalam K, Montell C. TRP channels. Annual review of biochemistry. 2007;76:387–417. - PMC - PubMed
    1. Puertollano R, Kiselyov K. TRPMLs: in sickness and in health. American journal of physiology. Renal physiology. 2009;296:F1245–1254. - PMC - PubMed
    1. Venkatachalam K, Wong CO, Zhu MX. The role of TRPMLs in endolysosomal trafficking and function. Cell calcium. 2014 - PMC - PubMed
    1. Bargal R, Avidan N, Ben-Asher E, Olender Z, Zeigler M, Frumkin A, Raas-Rothschild A, Glusman G, Lancet D, Bach G. Identification of the gene causing mucolipidosis type IV. Nature genetics. 2000;26:118–123. - PubMed

Publication types

MeSH terms