Rate of CRL4(CRBN) substrate Ikaros and Aiolos degradation underlies differential activity of lenalidomide and pomalidomide in multiple myeloma cells by regulation of c-Myc and IRF4
- PMID: 26430725
- PMCID: PMC4635186
- DOI: 10.1038/bcj.2015.66
Rate of CRL4(CRBN) substrate Ikaros and Aiolos degradation underlies differential activity of lenalidomide and pomalidomide in multiple myeloma cells by regulation of c-Myc and IRF4
Abstract
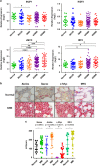
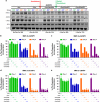
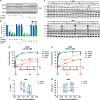
Recent discoveries suggest that the critical events leading to the anti-proliferative activity of the IMiD immunomodulatory agents lenalidomide and pomalidomide in multiple myeloma (MM) cells are initiated by Cereblon-dependent ubiquitination and proteasomal degradation of substrate proteins Ikaros (IKZF1) and Aiolos (IKZF3). By performing kinetic analyses, we found that the downregulation or proteasomal degradation of Ikaros and Aiolos led to specific and sequential downregulation of c-Myc followed by IRF4 and subsequent growth inhibition and apoptosis. Notably, to ensure growth inhibition and cell death, sustained downregulation of Ikaros and Aiolos, c-Myc or IRF4 expression was required. In addition, we found that the half-maximal rate, rather than the final extent of Ikaros and Aiolos degradation, correlated to the relative efficacy of growth inhibition by lenalidomide or pomalidomide. Finally, we observed that all four transcription factors were elevated in primary MM samples compared with normal plasma cells. Taken together, our results suggest a functional link between Ikaros and Aiolos, and the pathological dysregulation of c-Myc and IRF4, and provide a new mechanistic understanding of the relative efficacy of lenalidomide and pomalidomide based on the kinetics of substrate degradation and downregulation of their downstream targets.
Conflict of interest statement
All authors on this manuscript are employed by, and are owners of equity shares of Celgene Corporation.
Figures


Similar articles
-
Immunomodulatory agents lenalidomide and pomalidomide co-stimulate T cells by inducing degradation of T cell repressors Ikaros and Aiolos via modulation of the E3 ubiquitin ligase complex CRL4(CRBN.).Br J Haematol. 2014 Mar;164(6):811-21. doi: 10.1111/bjh.12708. Epub 2013 Dec 13. Br J Haematol. 2014. PMID: 24328678 Free PMC article.
-
The BET bromodomain inhibitor CPI203 improves lenalidomide and dexamethasone activity in in vitro and in vivo models of multiple myeloma by blockade of Ikaros and MYC signaling.Haematologica. 2017 Oct;102(10):1776-1784. doi: 10.3324/haematol.2017.164632. Epub 2017 Jul 27. Haematologica. 2017. PMID: 28751557 Free PMC article.
-
CK1α and IRF4 are essential and independent effectors of immunomodulatory drugs in primary effusion lymphoma.Blood. 2018 Aug 9;132(6):577-586. doi: 10.1182/blood-2018-01-828418. Epub 2018 Jun 28. Blood. 2018. PMID: 29954751 Free PMC article.
-
Targeting Ikaros and Aiolos: reviewing novel protein degraders for the treatment of multiple myeloma, with a focus on iberdomide and mezigdomide.Expert Rev Hematol. 2024 Aug;17(8):445-465. doi: 10.1080/17474086.2024.2382897. Epub 2024 Jul 27. Expert Rev Hematol. 2024. PMID: 39054911 Review.
-
Molecular mechanism of action of immune-modulatory drugs thalidomide, lenalidomide and pomalidomide in multiple myeloma.Leuk Lymphoma. 2013 Apr;54(4):683-7. doi: 10.3109/10428194.2012.728597. Epub 2012 Sep 28. Leuk Lymphoma. 2013. PMID: 22966948 Free PMC article. Review.
Cited by
-
First-in-Human, Single- and Multiple-Ascending-Dose Studies in Healthy Subjects to Assess Pharmacokinetics, Pharmacodynamics, and Safety/Tolerability of Iberdomide, a Novel Cereblon E3 Ligase Modulator.Clin Pharmacol Drug Dev. 2021 May;10(5):471-485. doi: 10.1002/cpdd.869. Epub 2020 Sep 23. Clin Pharmacol Drug Dev. 2021. PMID: 32969202 Free PMC article. Clinical Trial.
-
High levels of CRBN isoform lacking IMiDs binding domain predicts for a worse response to IMiDs-based upfront therapy in newly diagnosed myeloma patients.Clin Exp Med. 2023 Dec;23(8):5227-5239. doi: 10.1007/s10238-023-01205-y. Epub 2023 Oct 10. Clin Exp Med. 2023. PMID: 37815734 Free PMC article.
-
Lenalidomide: A Review in Newly Diagnosed Multiple Myeloma as Maintenance Therapy After ASCT.Drugs. 2017 Sep;77(13):1473-1480. doi: 10.1007/s40265-017-0795-0. Drugs. 2017. PMID: 28791622 Review.
-
Inhibition of bromodomain and extra-terminal (BET) proteins increases NKG2D ligand MICA expression and sensitivity to NK cell-mediated cytotoxicity in multiple myeloma cells: role of cMYC-IRF4-miR-125b interplay.J Hematol Oncol. 2016 Dec 1;9(1):134. doi: 10.1186/s13045-016-0362-2. J Hematol Oncol. 2016. PMID: 27903272 Free PMC article.
-
Cereblon in health and disease.Pflugers Arch. 2016 Aug;468(8):1299-309. doi: 10.1007/s00424-016-1854-1. Epub 2016 Jun 24. Pflugers Arch. 2016. PMID: 27343012 Review.
References
-
- 1Ito T, Ando H, Suzuki T, Ogura T, Hotta K, Imamura Y et al. Identification of a primary target of thalidomide teratogenicity. Science 2010; 327: 1345–1350. - PubMed
-
- 5Gandhi AK, Kang J, Havens CG, Conklin T, Ning Y, Wu L et al. Immunomodulatory agents lenalidomide and pomalidomide co-stimulate T cells by inducing degradation of T cell repressors Ikaros and Aiolos via modulation of the E3 ubiquitin ligase complex CRL4CRBN. Br J Haematol 2014; 164: 811–821. - PMC - PubMed
MeSH terms
Substances
LinkOut - more resources
Full Text Sources
Other Literature Sources
Medical

