. 2015 Sep 30;35(39):13275-86.
doi: 10.1523/JNEUROSCI.1034-15.2015.

Neuronal Store-Operated Calcium Entry and Mushroom Spine Loss in Amyloid Precursor Protein Knock-In Mouse Model of Alzheimer's Disease

Affiliations

Neuronal Store-Operated Calcium Entry and Mushroom Spine Loss in Amyloid Precursor Protein Knock-In Mouse Model of Alzheimer's Disease

Hua Zhang et al. J Neurosci. .

Abstract

Alzheimer's disease (AD) is the most common reason for elderly dementia in the world. We proposed that memory loss in AD is related to destabilization of mushroom postsynaptic spines involved in long-term memory storage. We demonstrated previously that stromal interaction molecule 2 (STIM2)-regulated neuronal store-operated calcium entry (nSOC) in postsynaptic spines play a key role in stability of mushroom spines by maintaining activity of synaptic Ca(2+)/calmodulin kinase II (CaMKII). Furthermore, we demonstrated previously that the STIM2-nSOC-CaMKII pathway is downregulated in presenilin 1 M146V knock-in (PS1-M146V KI) mouse model of AD, leading to loss of hippocampal mushroom spines in this model. In the present study, we demonstrate that hippocampal mushroom postsynaptic spines are also lost in amyloid precursor protein knock-in (APPKI) mouse model of AD. We demonstrated that loss of mushroom spines occurs as a result of accumulation of extracellular β-amyloid 42 in APPKI culture media. Our results indicate that extracellular Aβ42 acts by overactivating mGluR5 receptor in APPKI neurons, leading to elevated Ca(2+) levels in endoplasmic reticulum, compensatory downregulation of STIM2 expression, impaired synaptic nSOC, and reduced CaMKII activity. Pharmacological inhibition of mGluR5 or overexpression of STIM2 rescued synaptic nSOC and prevented mushroom spine loss in APPKI hippocampal neurons. Our results indicate that downregulation of synaptic STIM2-nSOC-CaMKII pathway causes loss of mushroom synaptic spines in both presenilin and APPKI mouse models of AD. We propose that modulators/activators of this pathway may have a potential therapeutic value for treatment of memory loss in AD. Significance statement: A direct connection between amyloid-induced synaptic mushroom spine loss and neuronal store-operated calcium entry pathway is shown. These results provide strong support for the calcium hypothesis of neurodegeneration and further validate the synaptic store-operated calcium entry pathway as a potential therapeutic target for Alzheimer's disease.

Keywords: calcium; imaging; synaptic; transgenic.


Figures

Figure 1.
Figure 1.
Loss of mushroom spines in APPKI hippocampal neurons. A, Confocal images of WT or APPKI DIV15 primary hippocampal neurons transfected with tdTomato. Scale bars, 10 μm. B, Total spine density and a fraction of various spine types (M, mushroom; S, stubby; T, thin) in hippocampal neuronal cultures from DIV15 WT and APPKI mice. The data are shown as mean ± SE (n ≥ 16 neurons from 3 batches of cultures). C, E, Confocal images of CA1 hippocampal neurons from 3-month-old (C) and 6-month-old (E) WTGFP and APPKIGFP mice. Scale bars, 10 μm. D, F, Total spine density and a fraction of various spine types (M, mushroom; S, stubby; T, thin) in hippocampal neurons from 3-month-old (D) and 6-month-old (F) WTGFP and APPKIGFP mice. The data are shown as mean ± SE (n ≥ 21 neurons, 3 month data from 3 mice of each group, 6 month data from 5 mice of each group). *p < 0.05, **p < 0.01, ***p < 0.001.
Figure 2.
Figure 2.
Extracellular Aβ42 causes mushroom spine loss in APPKI neurons. A, Confocal images of WT DIV17 primary hippocampal neurons transfected with tdTomato. Neurons were exposed to 1 or 5 μm42 ADDLs for 48 h as indicated. Ctrl, Control. Scale bars, 10 μm. B, An average fraction of mushroom spines (MS) is shown for DIV17 WT neurons in control conditions and after ADDL exposure as mean ± SE (n = 20 neurons from 2 batches of cultures). **p < 0.01, ***p < 0.001. C, Aβ40 and Aβ42 concentrations in the DIV15 culture medium for WT and APPKI cultures, for WT + APPm, and for APP + WTm. The data are shown as mean ± SE (n = 2 independent experiments). D, Confocal images of DIV15 WT, APPKI, WT + APPm, and APPKI + WTm primary hippocampal neurons transfected with tdTomato. Scale bars, 10 μm. E, An average fraction of mushroom spines (MS) is shown for DIV15 WT, APPKI, WT + APPm, and APPKI + WTm as mean ± SE (n ≥ 19 neurons from 2 independent experiments). **p < 0.01, ***p < 0.001.
Figure 3.
Figure 3.
ER Ca2+ signaling dysregulation in APPKI hippocampal neurons. A, Somatic fura-2 Ca2+ signals (F340/F380) is shown for DIV15 WT and APPKI hippocampal neurons. The neurons were incubated for 30 s in Ca2+-free media and challenged with 5 μm IO. Individual cell traces (gray) and average traces (red) are shown for each experimental group. The IO-releasable ER Ca2+ pool was calculated as the area under IO-induced fura-2 signal for each neuron. The responses were averaged across different neurons and experiments and presented as mean ± SE (n ≥ 88 neurons from 3 batches of cultures). **p < 0.01. B, Somatic fura-2 Ca2+ signals (F340/F380) are shown for DIV15 WT and APPKI hippocampal neurons. The neurons were incubated for 30 min in Ca2+-free media in the presence of 1 μm Tg and returned to the media containing 2 mm Ca2+ to trigger nSOC. Individual cell traces (gray) and average traces (red) are shown for each experimental group. The amplitude of somatic nSOC was determined for each neuron. The average somatic nSOC peak amplitude is shown as mean ± SE (n ≥ 129 neurons from 3 batches of cultures). ***p < 0.001. C, Synaptic GCaMP5.3 Ca2+ signals (F/F0) are shown for DIV15 WT and APPKI hippocampal neurons. The neurons were incubated for 30 min in Ca2+-free media in the presence of 1 μm Tg and returned to the media containing 2 mm Ca2+ to trigger synaptic nSOC. The neurons were challenged by 100 μm DHPG 50 s before addition of 2 mm Ca2+. The average synaptic nSOC peak responses is shown as mean ± SE (n ≥ 250 spines from 6 batches of cultures). ***p < 0.001. D, The expression levels of STIM1, STIM2, PSD95, pCAMKII, and CAMKII proteins were analyzed by Western blotting of lysates from three different batches of WT and APPKI DIV15 hippocampal cultures. GAPDH was used as a loading control. E, Expression levels of each protein were normalized to GAPDH for every sample. These values were normalized to WT for every batch of cells. The average values are shown as mean ±SE (n = 3 batched of cultures). **p < 0.01, ***p < 0.001.
Figure 4.
Figure 4.
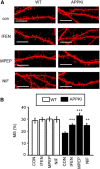
Evaluation of Ca2+ signaling inhibitors in mushroom spine loss assay with APPKI hippocampal cultures. A, Confocal images of DIV15 WT or APPKI DIV15 primary hippocampal neurons transfected with tdTomato. The cultures were treated for 16 h with 5 μm ifenprodil (IFEN), 5 μm MPEP, or 1 μm nifedipine (NIF) before fixation. con, Control. Scale bars, 10 μm. B, An average fraction of mushroom spines (MS) is shown for WT and APPKI neurons in control conditions (CON) and after exposure to 5 μm ifenprodil (IFEN), 5 μm MPEP, or 1 μm nifedipine (NIF). At each condition, the average fraction of mushroom spines is shown as mean ± SE (n ≥ 20 neurons from 3 batches of cultures). **p < 0.01, ***p < 0.001.
Figure 5.
Figure 5.
mGluR5 antagonist rescues Ca2+ signaling impairment in APPKI neurons. A, Somatic fura-2 Ca2+ signals (F340/F380) are shown for DIV15 WT and APPKI hippocampal neurons in control conditions and after 16 h exposure to 5 μm MPEP (+MPEP). The neurons were incubated for 30 s in Ca2+-free media and challenged with 5 μm IO. Individual cell traces (gray) and average traces (red) are shown for each experimental group. B, The IO-releasable ER Ca2+ pool was calculated as the area under IO-induced fura-2 signal for each neuron. The responses were averaged across different neurons in each group and presented as mean ± SE (n ≥ 91 neurons from 3 batches of cultures). The results are compared for control group (C) and for the group after incubation with 5 μm MPEP (+M). ***p < 0.001. C, Somatic fura-2 Ca2+ signals (F340/F380) are shown for DIV15 WT and APPKI hippocampal neurons in control conditions and after 16 h exposure to 5 μm MPEP (+MPEP). The neurons were incubated for 30 min in Ca2+-free media in the presence of 1 μm Tg and returned to the media containing 2 mm Ca2+ to trigger nSOC. Individual cell traces (gray) and average traces (red) are shown for each experimental group. D, The amplitude of somatic nSOC was determined for each neuron. The average somatic nSOC peak amplitude is shown as mean ± SE (n ≥ 77 neurons from 3 batches of cultures). The results are compared for control group (C) and for the group after incubation with 5 μm MPEP (+M). ***p < 0.001. E, Synaptic GCaMP5.3 Ca2+ signals (F/F0) are shown for DIV15 WT and APPKI hippocampal neurons in control conditions and after 16 h exposure to 5 μm MPEP (+MPEP). The neurons were incubated for 30 min in Ca2+-free media in the presence of 1 μm Tg and returned to the media containing 2 mm Ca2+ to trigger synaptic nSOC. The neurons were challenged by 100 μm DHPG 50 s before addition of 2 mm Ca2+. F, The average synaptic nSOC peak responses for different groups are shown as mean ± SE (n ≥ 60 spines, WT groups from 4 batches of cultures, APPKI groups from 2 batches of cultures). The results are compared for the control group (C) and for the group after incubation with 5 μm MPEP (+M). ***p < 0.001.
Figure 6.
Figure 6.
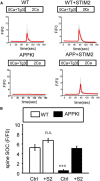
STIM2 overexpression rescues spine nSOC in APPKI neurons. A, Synaptic GCaMP5.3 Ca2+ signals (F/F0) are shown for DIV15 WT and APPKI hippocampal neurons in control conditions and after transfection with mSTIM2 (+ STIM2). The neurons were incubated for 30 min in Ca2+-free media in the presence of 1 μm Tg and returned to the media containing 2 mm Ca2+ to trigger synaptic nSOC. The neurons were challenged by 100 μm DHPG 50 s before addition of 2 mm Ca2+. B, The average synaptic nSOC peak responses for different groups are shown as mean ± SE (n ≥ 74 spines from 3 to 4 batches of cultures). The results are compared for control group (Ctrl) and for the group transfected with STIM2 (+ S2). ***p < 0.001.
Figure 7.
Figure 7.
STIM2 overexpression rescues mushroom spines and CAMKII signaling pathway in APPKI neuronal cultures. A, Confocal images of WT and APPKI DIV16 primary hippocampal neurons transfected with tdTomato or cotransfected with tdTomato and mSTIM2 (+ STIM2). Scale bars, 10 μm. B, An average fraction of mushroom spines (MS) is shown for DIV16 WT and APPKI neurons in control conditions and after STIM2 overexpression (+ STIM2). The data are shown as mean ± SE (n ≥ 19 neurons from 3 batches of cultures). ***p < 0.001. C, The expression levels of STIM2, PSD95, pCAMKII, and CAMKII were analyzed by Western blotting of lysates from DIV15 WT and APPKI hippocampal neuronal cultures. The results with cultures infected with Lenti–NLS–GFP (G) and Lenti–mSTIM2 (S2) are compared. GAPDH was used as a loading control. D, Expression levels of each protein were normalized to GAPDH for every sample. These values were normalized to Lenti–GFP-infected WT cells for every batch of cells. The average values are shown as mean ± SE (n = 3 batches of cultures). *p < 0.05, ***p < 0.001.
Figure 8.
Figure 8.
Overexpressing STIM2 rescues mushroom spine loss in APPKI mice in vivo. A, Confocal images of CA1 hippocampal neurons from 6-month-old WTGFP and APPKIGFP mice infected with AAV–GFP (+AAV-GFP) and AAV–STIM2 (+AAV-S2) viruses. Scale bars, 10 μm. B, Fraction of mushroom spines (MS) in hippocampal slices from 6-month-old WTGFP and APPKIGFP mice infected with AAV–GFP (GFP) and AAV–STIM2 (S2) viruses. The average fraction of mushroom spines is shown as mean ± SE (n ≥ 23 neurons, WTGFP + AAVGFP group from 3 mice, all other groups from 6 mice). ***p < 0.001.
Figure 9.
Figure 9.
Synaptic nSOC and loss of mushroom spines in APPKI hippocampal neurons. A, Long-term maintenance of mushroom hippocampal spines in WT neurons depends on synaptic nSOC and activity of synaptic CaMKII (Sun et al., 2014). Synaptic nSOC is gated by STIM2 protein that is regulated by synaptic ER Ca2+ levels (Sun et al., 2014). Filling state of ER Ca2+ stores influenced by activity of synaptic mGluR5 receptors, which are activated by extracellular glutamate (Glu). B, Accumulation of Aβ42 in extracellular media of APPKI neurons causes supernormal and continuous activation of synaptic mGluR5 receptors (Renner et al., 2010; Um et al., 2013). Resulting elevation of ER Ca2+ levels causes compensatory downregulation on STIM2 expression and synaptic nSOC. Reduced synaptic nSOC causes reduction in synaptic CaMKII activity, leading to destabilization and loss of mushroom spines in APPKI neurons.

Similar articles

Cited by

References

    1. Anekonda TS, Quinn JF, Harris C, Frahler K, Wadsworth TL, Woltjer RL. L-type voltage-gated calcium channel blockade with isradipine as a therapeutic strategy for Alzheimer's disease. Neurobiol Dis. 2011;41:62–70. doi: 10.1016/j.nbd.2010.08.020. - DOI - PMC - PubMed
    1. Benilova I, Karran E, De Strooper B. The toxic Abeta oligomer and Alzheimer's disease: an emperor in need of clothes. Nat Neurosci. 2012;15:349–357. doi: 10.1038/nn.3028. - DOI - PubMed
    1. Bourne J, Harris KM. Do thin spines learn to be mushroom spines that remember? Curr Opin Neurobiol. 2007;17:381–386. doi: 10.1016/j.conb.2007.04.009. - DOI - PubMed
    1. Bourne JN, Harris KM. Balancing structure and function at hippocampal dendritic spines. Annu Rev Neurosci. 2008;31:47–67. doi: 10.1146/annurev.neuro.31.060407.125646. - DOI - PMC - PubMed
    1. De Felice FG, Velasco PT, Lambert MP, Viola K, Fernandez SJ, Ferreira ST, Klein WL. Abeta oligomers induce neuronal oxidative stress through an N-methyl-d-aspartate receptor-dependent mechanism that is blocked by the Alzheimer drug memantine. J Biol Chem. 2007;282:11590–11601. doi: 10.1074/jbc.M607483200. - DOI - PubMed

Publication types

MeSH terms

Substances