. 2015 Oct 13;112(41):12800-5.
doi: 10.1073/pnas.1516594112. Epub 2015 Sep 28.

TMEM16F is required for phosphatidylserine exposure and microparticle release in activated mouse platelets

Affiliations

TMEM16F is required for phosphatidylserine exposure and microparticle release in activated mouse platelets

Toshihiro Fujii et al. Proc Natl Acad Sci U S A. .

Abstract

Phosphatidylserine (PtdSer) exposure on the surface of activated platelets requires the action of a phospholipid scramblase(s), and serves as a scaffold for the assembly of the tenase and prothrombinase complexes involved in blood coagulation. Here, we found that the activation of mouse platelets with thrombin/collagen or Ca(2+) ionophore at 20 °C induces PtdSer exposure without compromising plasma membrane integrity. Among five transmembrane protein 16 (TMEM16) members that support Ca(2+)-dependent phospholipid scrambling, TMEM16F was the only one that showed high expression in mouse platelets. Platelets from platelet-specific TMEM16F-deficient mice exhibited defects in activation-induced PtdSer exposure and microparticle shedding, although α-granule and dense granule release remained intact. The rate of tissue factor-induced thrombin generation by TMEM16F-deficient platelets was severely reduced, whereas thrombin-induced clot retraction was unaffected. The imaging of laser-induced thrombus formation in whole animals showed that PtdSer exposure on aggregated platelets was TMEM16F-dependent in vivo. The phenotypes of the platelet-specific TMEM16F-null mice resemble those of patients with Scott syndrome, a mild bleeding disorder, indicating that these mice may provide a useful model for human Scott syndrome.

Keywords: calcium; microvesicles; phosphatidylserine; platelets; scramblase.


Conflict of interest statement

The authors declare no conflict of interest.

Figures

Fig. S1.
Fig. S1.
Apoptotic PtdSer exposure. W3 cells were left untreated or treated for 2 or 4 h with 30 U/mL human FasL. The cells were stained by Cy5-labeled Annexin V, SYTOX Blue, and Alexa Fluor 488-conjugated phalloidin and analyzed by flow cytometry.
Fig. 1.
Fig. 1.
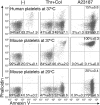
PtdSer exposure on activated mouse platelets. Human and murine platelets were treated for 5 min at 20 °C or 37 °C with 0.5 U/mL thrombin plus 10 μg/mL collagen or 1 μM A23187 in Tyrode-H buffer containing 1 mM CaCl2. The cells were stained with Cy5-Annexin V and Alexa Fluor 488-phalloidin and analyzed by flow cytometry. The experiments were performed three times, and the average values are shown with SD.
Fig. 2.
Fig. 2.
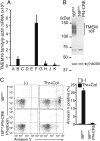
Requirement of TMEM16F for PtdSer exposure on activated mouse platelets. (A) TMEM16 family expression in mouse platelets. RNA from mouse platelets was subjected to real-time RT-PCR for the 10 TMEM16 family members. Each mRNA level is expressed relative to β-actin mRNA. The experiments were performed three times, and the average values are shown with SD (bars). (B) TMEM16F Western blotting of mouse platelets. Cell lysates (5 μg protein) from platelets of TMEM16Ffl/fl and TMEM16Ffl/fl;Pf4-CRE mice were analyzed by Western blotting with anti-TMEM16F. The TMEM16F band is indicated. (C) Platelets from TMEM16Ffl/fl and TMEM16Ffl/fl;Pf4-CRE mice were treated at 20 °C for 5 min with 0.5 U/mL thrombin plus 10 μg/mL collagen (Thr + Col) in Tyrode-H buffer with 1 mM CaCl2. The activated platelets were stained with phycoerythrin/cyanin 7 (PE/Cy7)–anti-CD41 mAb, Cy5-Annexin V, and Alexa Fluor 488-phalloidin (C) and analyzed by flow cytometry. FACS profiles for phalloidin and Annexin V staining in the CD41-positive population are shown. The experiments were performed three times, and the percentages of Annexin V-positive and phalloidin-negative populations are plotted (Right) with SD (bars).
Fig. S2.
Fig. S2.
RT-PCR analysis for TMEM16 family in human platelets. RNA from human platelets was reverse-transcribed. Using an aliquot of cDNA corresponding to 5 × 10⁵ platelets, PCR was carried out with a set of primers for the indicated TMEM16 family members. The PCR products were separated by electrophoresis through 2% (wt/vol) agarose gel and visualized by staining with ethidium bromide.
Fig. S3.
Fig. S3.
Activation of mouse platelets. (A and B) Platelets from TMEM16Ffl/fl and TMEM16Ffl/fl;Pf4-CRE mice were treated at 20 °C for 5 min with 0.5 U/mL thrombin plus 10 μg/mL collagen (Thr + Col) in Tyrode-H buffer containing 1 mM CaCl2. The activated platelets were stained with PE/Cy7–anti-CD41 mAb and Fluo4-AM (A) or FITC-anti-CD62P mAb (B) and analyzed by flow cytometry. FACS profiles for Fluo4 and CD62 in the CD41-positive population are shown. The experiments were performed three times, and the percentages of the Fluo4-, and CD62-positive populations are plotted (Right) with SD (bars). (C) Platelets from TMEM16Ffl/fl or TMEM16Ffl/fl;Pf4-CRE mice (n = 7–10 mice per group) were stimulated with 1 μM A23187 or 0.5 U/mL thrombin plus 10 μg/mL collagen in the presence of 1 mM CaCl2, and the ATP level in the supernatants was determined. The red bar indicates the average value. Two-tailed Student t tests were used for statistical testing between two groups. n.s., not significant.
Fig. 3.
Fig. 3.
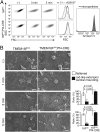
TMEM16F-dependent microparticle release from activated platelets. (A) TMEM16F-dependent microparticle formation. TMEM16Ffl/fl and TMEM16Ffl/fl;Pf4-CRE platelets (4 × 10⁵) were left untreated or treated with 1 μM A23187 in 0.2 mL of Tyrode-H buffer with 1 mM CaCl2 at 20 °C for 3 or 5 min and stained with CD41-PE/Cy7. The FSC/side scatter (SSC) profiles of CD41-positive populations are shown. (Center) Merged FSC profiles in unstimulated or 5-min stimulated platelets. (Right) Microparticles were collected by centrifugation from the stimulated WT platelets and stained with Cy5-Annexin V. (B) Scanning EM images of activated platelets. TMEM16Ffl/fl and TMEM16Ffl/fl;Pf4-CRE platelets (3 × 10⁵) were left unstimulated or stimulated as in A with 1 μM A23187 for 1, 3, or 5 min in the presence of 1 mM CaCl2. The adherent platelets were observed by scanning EM. (Scale bar: 2 µm.) The 3-min or 5-min activated platelets (approximately 300 platelets in three fields for each) were classified into flattened or rod-like extension and central mounting categories, and their percentages are plotted (Right). The Student t test was used for statistical analysis, and P values are shown.
Fig. 4.
Fig. 4.
Contribution of TMEM16F to PtdSer-mediated thrombin formation by platelets and microparticles. (A and B) Thrombin generation assay with TMEM16F-expressing or -deficient platelets. Washed platelets (1.2 × 10⁷, three independent preparations each) from TMEM16Ffl/fl or TMEM16Ffl/fl;Pf4-CRE mice were mixed with 6 μL of PFP in 120 μL Tyrode-H buffer containing 8 mM CaCl2 in the absence (A) or presence of 0.1, 0.3, or 1.0 μg/mL D89E (B) and incubated at 20 °C with 8.3 pM human tissue factor. Thrombin activity was assayed with Z-GGR-AMC. (C) Thrombin generation by microparticles. Platelets (1.2 × 10⁷) from TMEM16Ffl/fl or TMEM16Ffl/fl;Pf4-CRE platelets (three independent preparations each) were stimulated at 20 °C for 5 min with 1 μM A23187 or left unstimulated in Tyrode-H buffer containing 1 mM CaCl2. The microparticles were collected and used for thrombin generation.
Fig. S4.
Fig. S4.
TMEM16F-indepdendent fibrin clot retraction and tail breeding. (A) Fibrin clot retraction. Platelets (4.5 ×10⁷ /mL) from TMEM16Ffl/fl and TMEM16Ffl/fl;Pf4-CRE mice were washed and resuspended in 0.3 mL Tyrode-H buffer containing 15% (vol/vol) PFP and transferred to an aggregometer cuvette. Fibrin clotting was initiated by adding 1 U/mL thrombin and 8 mM CaCl2. (Left) Retracting clot at the indicated times. (Right) Clot surface area was assessed by digital processing at the indicated times, and clot retraction kinetics were determined as percentages of the maximum retraction (volume of platelet-free area; n ≥ 4). The average values are shown with SD (bars). (B) Tail bleeding times of TMEM16Ffl/+;Pf4-CRE and TMEM16Ffl/fl;Pf4-CRE mice (n ≥ 7) are shown with average values (bars). Two-tailed Student t tests were used for statistical testing between two groups. n.s., not significant.
Fig. 5.
Fig. 5.
Analysis of PtdSer exposure on platelets aggregated at a thrombus in a laser/ROS injury model. TMEM16Ffl/+;Pf4-CRE and TMEM16Ffl/fl;Pf4-CRE mice were injected with DyLight 649-anti-GP1bβmAb, FITC-Annexin V, Hoechst 33342, and hematoporphyrin. After anesthesia, the testicular vein was exposed and visualized by using a high-speed resonance scanning confocal microscope with highly sensitive GaAs detectors. Platelet aggregations were induced by photochemically induced ROS from hematoporphyrin within vessel lumens by laser irradiations. (A) Representative snap-shot raw images of developed thrombus. Note that the early responses of platelet aggressions were comparable in TMEM16F-deficient mice and control mice (40 s). However, the developed thrombus in TMEM16F-deficient mice was fragile, frequently collapsed by blood flow (80 s), and smaller in later phase (150 s) compared with the WT mice. Arrows indicate blood flow direction. (Scale bars: 20 μm.) (B) Quantification of thrombus area at 150 s using automatic software analysis (n = 20 vessels from n = 5 animals). (C and D) Ratiometric views and quantification analysis. Ratios are displayed in pseudocolor. Note that the FITC/DyLight 649 ratio increased within thrombus area in the WT mice, which was attenuated in TMEM16F-deficient mice. The FITC/DyLight 649 ratios were determined in 100 regions from 20 vessels from five animals, and the average values were plotted (D). We used ratiometric analysis to minimize the photobleaching effect by laser irradiation. The original videos are supplied as Movies S1A and S1B and S2A and S2B.

Similar articles

Cited by

References

    1. Leventis PA, Grinstein S. The distribution and function of phosphatidylserine in cellular membranes. Annu Rev Biophys. 2010;39:407–427. - PubMed
    1. Balasubramanian K, Schroit AJ. Aminophospholipid asymmetry: A matter of life and death. Annu Rev Physiol. 2003;65:701–734. - PubMed
    1. Segawa K, et al. Caspase-mediated cleavage of phospholipid flippase for apoptotic phosphatidylserine exposure. Science. 2014;344(6188):1164–1168. - PubMed
    1. Suzuki J, Denning DP, Imanishi E, Horvitz HR, Nagata S. Xk-related protein 8 and CED-8 promote phosphatidylserine exposure in apoptotic cells. Science. 2013;341(6144):403–406. - PubMed
    1. Suzuki J, et al. Calcium-dependent phospholipid scramblase activity of TMEM16 protein family members. J Biol Chem. 2013;288(19):13305–13316. - PMC - PubMed

Publication types

MeSH terms

Supplementary concepts

LinkOut - more resources