Regulation of Adaptive NK Cells and CD8 T Cells by HLA-C Correlates with Allogeneic Hematopoietic Cell Transplantation and with Cytomegalovirus Reactivation
- PMID: 26416275
- PMCID: PMC4610859
- DOI: 10.4049/jimmunol.1401990
Regulation of Adaptive NK Cells and CD8 T Cells by HLA-C Correlates with Allogeneic Hematopoietic Cell Transplantation and with Cytomegalovirus Reactivation
Abstract
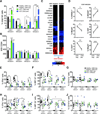
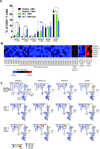
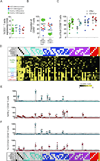
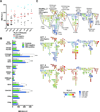
Mass cytometry was used to investigate the effect of CMV reactivation on lymphocyte reconstitution in hematopoietic cell transplant patients. For eight transplant recipients (four CMV negative and four CMV positive), we studied PBMCs obtained 6 mo after unrelated donor hematopoietic cell transplantation (HCT). Forty cell-surface markers, distinguishing all major leukocyte populations in PBMC, were analyzed with mass cytometry. This group included 34 NK cell markers. Compared with healthy controls, transplant recipients had higher HLA-C expression on CD56(-)CD16(+) NK cells, B cells, CD33(bright) myeloid cells, and CD4CD8 T cells. The increase in HLA-C expression was greater for CMV-positive HCT recipients than for CMV negative recipients. Present in CMV-positive HCT recipients, but not in CMV-negative HCT recipients or controls, is a population of killer cell Ig-like receptor (KIR)-expressing CD8 T cells not previously described. These CD8 T cells coexpress CD56, CD57, and NKG2C. The HCT recipients also have a population of CD57(+)NKG2A(+) NK cells that preferentially express KIR2DL1. An inverse correlation was observed between the frequencies of CD57(+)NKG2C(+) NK cells and CD57(+)NKG2A(+) NK cells. Although CD57(+)NKG2A(+) NK cells are less abundant in CMV-positive recipients, their phenotype is of a more activated cell than the CD57(+)NKG2A(+) NK cells of controls and CMV-negative HCT recipients. These data demonstrate that HCT and CMV reactivation are associated with an increased expression of HLA-C. This could influence NK cell education during lymphocyte reconstitution. The increased inhibitory KIR expression by proliferating CMV-specific CD8 T cells suggests regulatory interactions between HLA-C and KIR might promote Graft-versus-Leukemia effects following transplantation.
Copyright © 2015 by The American Association of Immunologists, Inc.
Figures


Similar articles
-
Enumeration of NKG2C+ natural killer cells early following allogeneic stem cell transplant recipients does not allow prediction of the occurrence of cytomegalovirus DNAemia.J Med Virol. 2015 Sep;87(9):1601-7. doi: 10.1002/jmv.24198. Epub 2015 Mar 19. J Med Virol. 2015. PMID: 25802229
-
Functional profile of cytomegalovirus (CMV)-specific CD8+ T cells and kinetics of NKG2C+ NK cells associated with the resolution of CMV DNAemia in allogeneic stem cell transplant recipients.J Med Virol. 2012 Feb;84(2):259-67. doi: 10.1002/jmv.22254. J Med Virol. 2012. PMID: 22170546
-
Modulation of the natural killer cell KIR repertoire by cytomegalovirus infection.Eur J Immunol. 2013 Feb;43(2):480-7. doi: 10.1002/eji.201242389. Epub 2012 Dec 12. Eur J Immunol. 2013. PMID: 23161492
-
CMV induces rapid NK cell maturation in HSCT recipients.Immunol Lett. 2013 Sep-Oct;155(1-2):11-3. doi: 10.1016/j.imlet.2013.09.020. Epub 2013 Sep 26. Immunol Lett. 2013. PMID: 24076315 Review.
-
Potential Beneficial Effects of Cytomegalovirus Infection after Transplantation.Front Immunol. 2018 Mar 1;9:389. doi: 10.3389/fimmu.2018.00389. eCollection 2018. Front Immunol. 2018. PMID: 29545802 Free PMC article. Review.
Cited by
-
Influence of KIR and NK Cell Reconstitution in the Outcomes of Hematopoietic Stem Cell Transplantation.Front Immunol. 2020 Sep 2;11:2022. doi: 10.3389/fimmu.2020.02022. eCollection 2020. Front Immunol. 2020. PMID: 32983145 Free PMC article. Review.
-
High Metabolic Function and Resilience of NKG2A-Educated NK Cells.Front Immunol. 2020 Sep 30;11:559576. doi: 10.3389/fimmu.2020.559576. eCollection 2020. Front Immunol. 2020. PMID: 33101277 Free PMC article.
-
Natural Killer Cell Interactions with Classical and Non-Classical Human Leukocyte Antigen Class I in HIV-1 Infection.Front Immunol. 2017 Nov 14;8:1496. doi: 10.3389/fimmu.2017.01496. eCollection 2017. Front Immunol. 2017. PMID: 29184550 Free PMC article. Review.
-
Class I HLA haplotypes form two schools that educate NK cells in different ways.Sci Immunol. 2016 Sep;1(3):eaag1672. doi: 10.1126/sciimmunol.aag1672. Epub 2016 Sep 9. Sci Immunol. 2016. PMID: 27868107 Free PMC article.
-
Not just leukemia: CMV may protect against lymphoma recurrence after allogeneic transplant.Leuk Lymphoma. 2017 Apr;58(4):759-761. doi: 10.1080/10428194.2016.1239265. Epub 2016 Oct 12. Leuk Lymphoma. 2017. PMID: 27733072 Free PMC article. No abstract available.
References
-
- Moretta A, Bottino C, Vitale M, Pende D, Biassoni R, Mingari MC, Moretta L. Receptors for HLA class-I molecules in human natural killer cells. Annu Rev Immunol. 1996;14:619–648. - PubMed
-
- Moretta A, Bottino C, Massimo V, Pende D, Cantoni C, Mingari MC, Biassoni R, Moretta L. Activating receptors and coreceptors involved in human natural killer cell-mediated cytolysis. Annu Rev Immunol. 2001;19:197–223. - PubMed
-
- Lanier LL. NK CELL RECEPTORS. Annu. Rev. Immunol. 1998;16:359–393. - PubMed
-
- Ljunggren HG, Kärre K. In search of the “missing self”: MHC molecules and NK cell recognition. Immunol Today. 1990;11:237–244. - PubMed
-
- Lanier LL, Corliss B, Phillips JH. Arousal and inhibition of human NK cells. Immunol. Rev. 1997;155:145–154. - PubMed
Publication types
MeSH terms
Substances
Grants and funding
LinkOut - more resources
Full Text Sources
Other Literature Sources
Medical
Research Materials

