. 2015 Sep 23;87(6):1215-1233.
doi: 10.1016/j.neuron.2015.09.016.

Insights into Autism Spectrum Disorder Genomic Architecture and Biology from 71 Risk Loci

Affiliations

Insights into Autism Spectrum Disorder Genomic Architecture and Biology from 71 Risk Loci

Stephan J Sanders et al. Neuron. .

Abstract

Analysis of de novo CNVs (dnCNVs) from the full Simons Simplex Collection (SSC) (N = 2,591 families) replicates prior findings of strong association with autism spectrum disorders (ASDs) and confirms six risk loci (1q21.1, 3q29, 7q11.23, 16p11.2, 15q11.2-13, and 22q11.2). The addition of published CNV data from the Autism Genome Project (AGP) and exome sequencing data from the SSC and the Autism Sequencing Consortium (ASC) shows that genes within small de novo deletions, but not within large dnCNVs, significantly overlap the high-effect risk genes identified by sequencing. Alternatively, large dnCNVs are found likely to contain multiple modest-effect risk genes. Overall, we find strong evidence that de novo mutations are associated with ASD apart from the risk for intellectual disability. Extending the transmission and de novo association test (TADA) to include small de novo deletions reveals 71 ASD risk loci, including 6 CNV regions (noted above) and 65 risk genes (FDR ≤ 0.1).


Figures

Figure 1
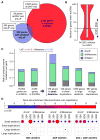
Figure 1. Overview of the Analysis
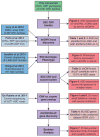
This manuscript describes the analysis of CNVs predicted from SNP genotyping data in 2,591 families from the SSC (green). The analysis steps are shown in the middle of the flowchart (purple). Additional datasets from genomic analysis of the SSC (blue) and other ASD cohorts (light blue) are integrated to maximize power. The results of the analysis are shown in the figures (red) and tables (light red), along with the text of the manuscript.
Figure 2
Figure 2. CNV Burden in the SSC
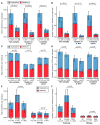
(A) The rate of dnCNVs per individual in probands and family-matched sibling controls for deletions (red) and duplications (blue) are compared for new families (n = 1,226; left), previously published families (n = 874; middle), and the combination of these two cohorts (n = 2,100; right). (B) The analysis presented in (A) is repeated except the number of genes within dnCNVs per individual is displayed rather than the rate of dnCNVs per individual. (C and D) The analyses presented in (A) and (B) are repeated using riCNVs instead of dnCNVs. (E) The rate of dnCNVs per individual is shown for probands (left three bars) and siblings (right three bars). Within each group, the rate of dnCNVs is shown for all individuals (left), females (middle), and males (right). No statistical comparison was made between probands and siblings for this analysis. (F) The analysis in (E) is repeated except the number of genes within dnCNVs per individual is displayed rather than the rate of dnCNVs per individual. Statistical significance was calculated using a one-sided sign test for (A), a one-sided paired Wilcoxon ranked-sum test (WRST) for (B)–(D), and a two-sided unpaired WRST for (E) and (F). Whiskers show the 95% confidence intervals throughout (A)–(F).
Figure 3
Figure 3. Genotype-Phenotype Correlations in the SSC
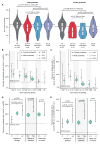
(A) The violin plot shows the distribution of non-verbal IQ (NVIQ) in male probands (left four violins) and female probands (right four violins). Each sex is split into four sets: probands with no dnCNVs or dnLoF mutations (gray), probands with a de novo deletion (red), probands with a de novo duplication (blue), and probands with a dnLoF (purple). Individuals with multiple de novo events in more than one category were included in all of the corresponding distributions. The overlaid boxplot shows the median and interquartile range (IQR). The horizontal black lines show the median for the probands with no dnCNVs or dnLoFs in each sex; the dashed line extends this estimate for females to the y axis. Statistical significance was calculated using a one-sided WRST; violin plots of deletions and duplications together and deletions, duplications, and LoF together are not shown. (B) The percent of probands with a dnLoF or dnCNV (y axis) is shown for male (green) and female (pink) probands binned by NVIQ (x axis). p values reflect the difference in de novo rate compared with siblings (horizontal dashed line at 10.7%) using a one-sided Fisher’s exact test; the whiskers show the 95% confidence intervals. The size of the circles represents the number of individuals in each group ranging from 4 to 694. (C) The analysis in (B) is repeated considering only de novo mutations at loci with an FDR ≤ 0.1. (D) The percent of probands with a dnLoF or dnCNV (y axis) is shown for three phenotypic factors. p values reflect the difference in de novo rate between groups of probands using a one-sided Fisher’s exact test; the whiskers show the 95% confidence intervals. The size of the circles represents the number of individuals in each group ranging from 170 to 2,177. The head size Z score is for the genetic deviation (Chaste et al., 2013). (E) The analysis in (D) is repeated considering only de novo mutations at loci with an FDR ≤ 0.1.
Figure 4
Figure 4. Association of Genetic Factors with ASD across the Size Spectrum
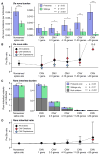
(A) The number of rare autosomal de novo mutations per individual are shown for dnLoF (nonsense and splice site only) in 1,911 SSC probands (purple) and 1,911 family-matched sibling controls (green) and for dnCNVs binned into five sizes by gene content in 2,100 SSC probands (purple) and 2,100 family-matched sibling controls (green). A significantly higher burden of de novo mutation is observed across the size range with the exception of “1 gene”; one-sided sign test; whiskers represent 95% confidence intervals. (B) The proband:sibling ratio for each size of de novo mutation is shown by the black diamonds and the black dashed line; whiskers represent the 95% confidence interval estimated by bootstrapping. The ratio is also shown for deletions (red) and duplications (blue). (C) The analysis shown in (A) is repeated for rare inherited variants in the same individuals. Significance was estimated using a one-sided paired Wilcoxon ranked-sum test with only rare inherited nonsense/splice site variants reaching nominal significance. (D) The analysis in (C) is repeated for rare inherited variants in the same individuals.
Figure 5
Figure 5. Small De Novo Deletions Are Enriched for Exome Mutations
(A) 2,080 unique genes are identified within pro-band dnCNVs (red) and 522 unique genes have dnLoFs in probands (purple); 58 unique genes are observed in both these datasets. (B) The median number of genes within validated dnCNVs in the SSC is seven; this threshold is used to distinguish small and large dnCNVs. (C) The number of de novo mutations per gene observed with exome sequencing of the SSC and ASC are shown in different groups of genes based on dnCNV overlap. Mutation rates are normalized for gene mutability based on gene size and GC content. Exome mutations are divided into silent (gray), missense (green), and LoF (purple). No excess of exome mutations is observed in the 2,080 genes within dnCNV regions compared to the 16,564 genes outside of dnCNVs. Dividing the dnCNV regions by size (≤7 genes versus >7 genes) and type (deletion versus duplication) reveals strong enrichment for dnLoF (p = 4 × 10⁻⁶, Fisher Exact Test) and dnMissense (p = 0.003) in small de novo deletions only. (D) The enrichment of genes within dnCNVs is shown by the size and shade of the circle (red and large = high degree of enrichment; blue and small = modest degree of enrichment); only results reaching nominal significance (hypergeometric test) are shown. Small de novo deletions show consistent enrichment for dnLoF and dnMissense mutations across three cohorts: SSC, Autism Sequencing Consortium (ASC), and Deciphering Developmental Disorders (DDD). This result is observed for dnCNVs detected in the SSC and Autism Genome Project (AGP) independently and in combination.
Figure 6
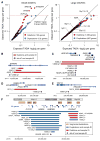
Figure 6. Small De Novo Deletions Intersect with ASD Genes
(A) The TADA FDR q value is an assessment of ASD association based on de novo and inherited variants identified by exome sequencing in the context of estimates of gene mutability. A low TADA FDR q value (high −log(q)) represents stronger ASD association. Observed TADA −log(q) values are shown against expected TADA −log(q) values derived from permutation testing. Each point represents one gene within a proband dnCNV. The black line represents random sampling of the genome, with no increased overlap between genes in dnCNVs and the genes identified by exome sequencing in ASD. Small de novo deletions (red, on the left) deviate dramatically from this expectation while the other three categories show expected or slightly less than expected enrichment for ASD genes. The four genes with the strongest evidence for ASD association are labeled for the small de novo deletions (left). The individual genes with the highest −log(q) value (Table S6) within each of six large dnCNV loci with the strongest evidence for ASD association (Table 2) are indicated by the locus name (right). (B) Three small de novo deletions and one dnLoF are observed in SHANK2. (C) Two small de novo deletions and five dnLoF are observed in ARID1B. (D) One small de novo deletion and one dnLoF are observed in KATB2. (E) One small de novo deletion and one dnLoF are observed in TRIP12. (F) Of the six large dnCNV loci with the strongest evidence for ASD association (Table 2) the 15q11.2-13 contains the gene with the lowest −log(q) value from the exome data: GABRB3.
Figure 7
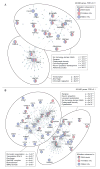
Figure 7. Protein-Protein Interaction Networks in ASD
(A) 28 ASD genes identified with a TADA FDR ≤0.01 were submitted as seeds to form a DAPPLE PPI network (Rossin et al., 2011). The seed genes are shown as circles in red and/or blue based on the sex of the ASD cases in whom the mutations were identified; the distribution of male and female mutations in the network does not differ from expectation (p = 0.97). Protein-protein interactions are shown as gray lines (edges) and additional genes are pulled into the network to form indirect connections. The network has a clear distinction into two halves (shown by the large ovals). All seed and network genes in each oval were submitted to DAVID (Dennis et al., 2003) and the top gene ontology terms are shown with Benjamini Hochberg corrected p values. (B) The analysis in (A) was repeated using all 65 ASD genes with an FDR ≤ 0.1 (Table 4).

Similar articles

Cited by

References

    1. Berkel S, Marshall CR, Weiss B, Howe J, Roeth R, Moog U, Endris V, Roberts W, Szatmari P, Pinto D, et al. Mutations in the SHANK2 synaptic scaffolding gene in autism spectrum disorder and mental retardation. Nat Genet. 2010;42:489–491. - PubMed
    1. Bucan M, Abrahams BS, Wang K, Glessner JT, Herman EI, Sonnenblick LI, Alvarez Retuerto AI, Imielinski M, Hadley D, Bradfield JP, et al. Genome-wide analyses of exonic copy number variants in a family-based study point to novel autism susceptibility genes. PLoS Genet. 2009;5:e1000536. - PMC - PubMed
    1. Chang J, Gilman SR, Chiang AH, Sanders SJ, Vitkup D. Genotype to phenotype relationships in autism spectrum disorders. Nat Neurosci. 2015;18:191–198. - PMC - PubMed
    1. Chaste P, Klei L, Sanders SJ, Murtha MT, Hus V, Lowe JK, Willsey AJ, Moreno-De-Luca D, Yu TW, Fombonne E, et al. Adjusting head circumference for covariates in autism: clinical correlates of a highly heritable continuous trait. Biol Psychiatry. 2013;74:576–584. - PMC - PubMed
    1. Coe BP, Witherspoon K, Rosenfeld JA, van Bon BW, Vultovan Silfhout AT, Bosco P, Friend KL, Baker C, Buono S, Vissers LE, et al. Refining analyses of copy number variation identifies specific genes associated with developmental delay. Nat Genet. 2014;46:1063–1071. - PMC - PubMed

Publication types