LGN Directs Interphase Endothelial Cell Behavior via the Microtubule Network
- PMID: 26398908
- PMCID: PMC4580422
- DOI: 10.1371/journal.pone.0138763
LGN Directs Interphase Endothelial Cell Behavior via the Microtubule Network
Abstract
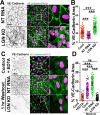
Angiogenic sprouts require coordination of endothelial cell (EC) behaviors as they extend and branch. Microtubules influence behaviors such as cell migration and cell-cell interactions via regulated growth and shrinkage. Here we investigated the role of the mitotic polarity protein LGN in EC behaviors and sprouting angiogenesis. Surprisingly, reduced levels of LGN did not affect oriented division of EC within a sprout, but knockdown perturbed overall sprouting. At the cell level, LGN knockdown compromised cell-cell adhesion and migration. EC with reduced LGN levels also showed enhanced growth and stabilization of microtubules that correlated with perturbed migration. These results fit a model whereby LGN influences interphase microtubule dynamics in endothelial cells to regulate migration, cell adhesion, and sprout extension, and reveal a novel non-mitotic role for LGN in sprouting angiogenesis.
Conflict of interest statement
Figures


Similar articles
-
Selective and Marked Blockade of Endothelial Sprouting Behavior Using Paclitaxel and Related Pharmacologic Agents.Am J Pathol. 2021 Dec;191(12):2245-2264. doi: 10.1016/j.ajpath.2021.08.017. Epub 2021 Sep 24. Am J Pathol. 2021. PMID: 34563512 Free PMC article.
-
LGN blocks the ability of NuMA to bind and stabilize microtubules. A mechanism for mitotic spindle assembly regulation.Curr Biol. 2002 Nov 19;12(22):1928-33. doi: 10.1016/s0960-9822(02)01298-8. Curr Biol. 2002. PMID: 12445386
-
Hic-5 mediates the initiation of endothelial sprouting by regulating a key surface metalloproteinase.J Cell Sci. 2016 Feb 15;129(4):743-56. doi: 10.1242/jcs.170571. Epub 2016 Jan 14. J Cell Sci. 2016. PMID: 26769900 Free PMC article.
-
Microtubule-targeting agents are clinically successful due to both mitotic and interphase impairment of microtubule function.Bioorg Med Chem. 2014 Sep 15;22(18):5050-9. doi: 10.1016/j.bmc.2014.02.035. Epub 2014 Mar 4. Bioorg Med Chem. 2014. PMID: 24650703 Review.
-
How do endothelial cells orientate?EXS. 2005;(94):3-15. doi: 10.1007/3-7643-7311-3_1. EXS. 2005. PMID: 15617467 Review.
Cited by
-
Nuclear SUN1 stabilizes endothelial cell junctions via microtubules to regulate blood vessel formation.Elife. 2023 Mar 29;12:e83652. doi: 10.7554/eLife.83652. Elife. 2023. PMID: 36989130 Free PMC article.
-
Proteostasis is essential during cochlear development for neuron survival and hair cell polarity.EMBO Rep. 2019 Sep;20(9):e47097. doi: 10.15252/embr.201847097. Epub 2019 Jul 19. EMBO Rep. 2019. PMID: 31321879 Free PMC article.
-
CLASP1 regulates endothelial cell branching morphology and directed migration.Biol Open. 2017 Oct 15;6(10):1502-1515. doi: 10.1242/bio.028571. Biol Open. 2017. PMID: 28860131 Free PMC article.
-
Orientation of the Mitotic Spindle in Blood Vessel Development.Front Cell Dev Biol. 2020 Sep 17;8:583325. doi: 10.3389/fcell.2020.583325. eCollection 2020. Front Cell Dev Biol. 2020. PMID: 33072763 Free PMC article. Review.
-
Matrix Stiffness Modulates Mesenchymal Stem Cell Sensitivity to Geometric Asymmetry Signals.Ann Biomed Eng. 2018 Jun;46(6):888-898. doi: 10.1007/s10439-018-2008-8. Epub 2018 Mar 14. Ann Biomed Eng. 2018. PMID: 29542050 Free PMC article.
References
Publication types
MeSH terms
Substances
Grants and funding
LinkOut - more resources
Full Text Sources
Other Literature Sources

