Vertical suppression of the EGFR pathway prevents onset of resistance in colorectal cancers
- PMID: 26392303
- PMCID: PMC4595628
- DOI: 10.1038/ncomms9305
Vertical suppression of the EGFR pathway prevents onset of resistance in colorectal cancers
Abstract
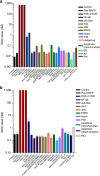
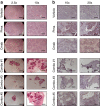
Molecular targeted drugs are clinically effective anti-cancer therapies. However, tumours treated with single agents usually develop resistance. Here we use colorectal cancer (CRC) as a model to study how the acquisition of resistance to EGFR-targeted therapies can be restrained. Pathway-oriented genetic screens reveal that CRC cells escape from EGFR blockade by downstream activation of RAS-MEK signalling. Following treatment of CRC cells with anti-EGFR, anti-MEK or the combination of the two drugs, we find that EGFR blockade alone triggers acquired resistance in weeks, while combinatorial treatment does not induce resistance. In patient-derived xenografts, EGFR-MEK combination prevents the development of resistance. We employ mathematical modelling to provide a quantitative understanding of the dynamics of response and resistance to these single and combination therapies. Mechanistically, we find that the EGFR-MEK Combo blockade triggers Bcl-2 and Mcl-1 downregulation and initiates apoptosis. These results provide the rationale for clinical trials aimed at preventing rather than intercepting resistance.
Figures


Similar articles
-
Blockade of EGFR and MEK intercepts heterogeneous mechanisms of acquired resistance to anti-EGFR therapies in colorectal cancer.Sci Transl Med. 2014 Feb 19;6(224):224ra26. doi: 10.1126/scitranslmed.3007947. Sci Transl Med. 2014. PMID: 24553387
-
Primary and acquired resistance of colorectal cancer cells to anti-EGFR antibodies converge on MEK/ERK pathway activation and can be overcome by combined MEK/EGFR inhibition.Clin Cancer Res. 2014 Jul 15;20(14):3775-86. doi: 10.1158/1078-0432.CCR-13-2181. Epub 2014 May 8. Clin Cancer Res. 2014. PMID: 24812410
-
Epidermal growth factor receptor: pathway, therapies, and pipeline.Clin Ther. 2013 Sep;35(9):1282-303. doi: 10.1016/j.clinthera.2013.08.007. Clin Ther. 2013. PMID: 24054705 Review.
-
Oncogenic activation of the RAS/RAF signaling pathway impairs the response of metastatic colorectal cancers to anti-epidermal growth factor receptor antibody therapies.Cancer Res. 2007 Mar 15;67(6):2643-8. doi: 10.1158/0008-5472.CAN-06-4158. Cancer Res. 2007. PMID: 17363584
-
Epidermal growth factor receptor as a therapeutic target in colorectal cancer.Clin Colorectal Cancer. 2003 Feb;2(4):246-51. doi: 10.3816/CCC.2003.n.006. Clin Colorectal Cancer. 2003. PMID: 12620146 Review.
Cited by
-
Cancer therapy: an evolved approach.Nature. 2016 Apr 14;532(7598):166-8. doi: 10.1038/532166a. Nature. 2016. PMID: 27075079 No abstract available.
-
Applications of patient-derived tumor xenograft models and tumor organoids.J Hematol Oncol. 2020 Jan 7;13(1):4. doi: 10.1186/s13045-019-0829-z. J Hematol Oncol. 2020. PMID: 31910904 Free PMC article. Review.
-
Application status and future prospects of the PDX model in lung cancer.Front Oncol. 2023 Mar 24;13:1098581. doi: 10.3389/fonc.2023.1098581. eCollection 2023. Front Oncol. 2023. PMID: 37035154 Free PMC article. Review.
-
Idelalisib induces PUMA-dependent apoptosis in colon cancer cells.Oncotarget. 2017 Jan 24;8(4):6102-6113. doi: 10.18632/oncotarget.14043. Oncotarget. 2017. PMID: 28008149 Free PMC article.
-
Feedback activation of HER3 attenuates response to EGFR inhibitors in colon cancer cells.Oncotarget. 2017 Jan 17;8(3):4277-4288. doi: 10.18632/oncotarget.13834. Oncotarget. 2017. PMID: 28032592 Free PMC article.
References
-
- Vogelstein B. & Kinzler K. W. Cancer genes and the pathways they control. Nat. Med. 10, 789–799 (2004). - PubMed
-
- Weinstein I. B. Cancer. Addiction to oncogenes--the achilles heal of cancer. Science 297, 63–64 (2002). - PubMed
-
- Misale S., Di Nicolantonio F., Sartore-Bianchi A., Siena S. & Bardelli A. Resistance to anti-EGFR therapy in colorectal cancer: from heterogeneity to convergent evolution. Cancer Discov. 4, 1269–1280 (2014). - PubMed
Publication types
MeSH terms
Substances
LinkOut - more resources
Full Text Sources
Other Literature Sources
Medical
Research Materials
Miscellaneous

