Review
. 2016 Mar:129:69-82.
doi: 10.1016/j.nlm.2015.09.005. Epub 2015 Sep 29.

Corruption of the dentate gyrus by "dominant" granule cells: Implications for dentate gyrus function in health and disease

Affiliations
Review

Corruption of the dentate gyrus by "dominant" granule cells: Implications for dentate gyrus function in health and disease

Helen E Scharfman et al. Neurobiol Learn Mem. 2016 Mar.

Abstract

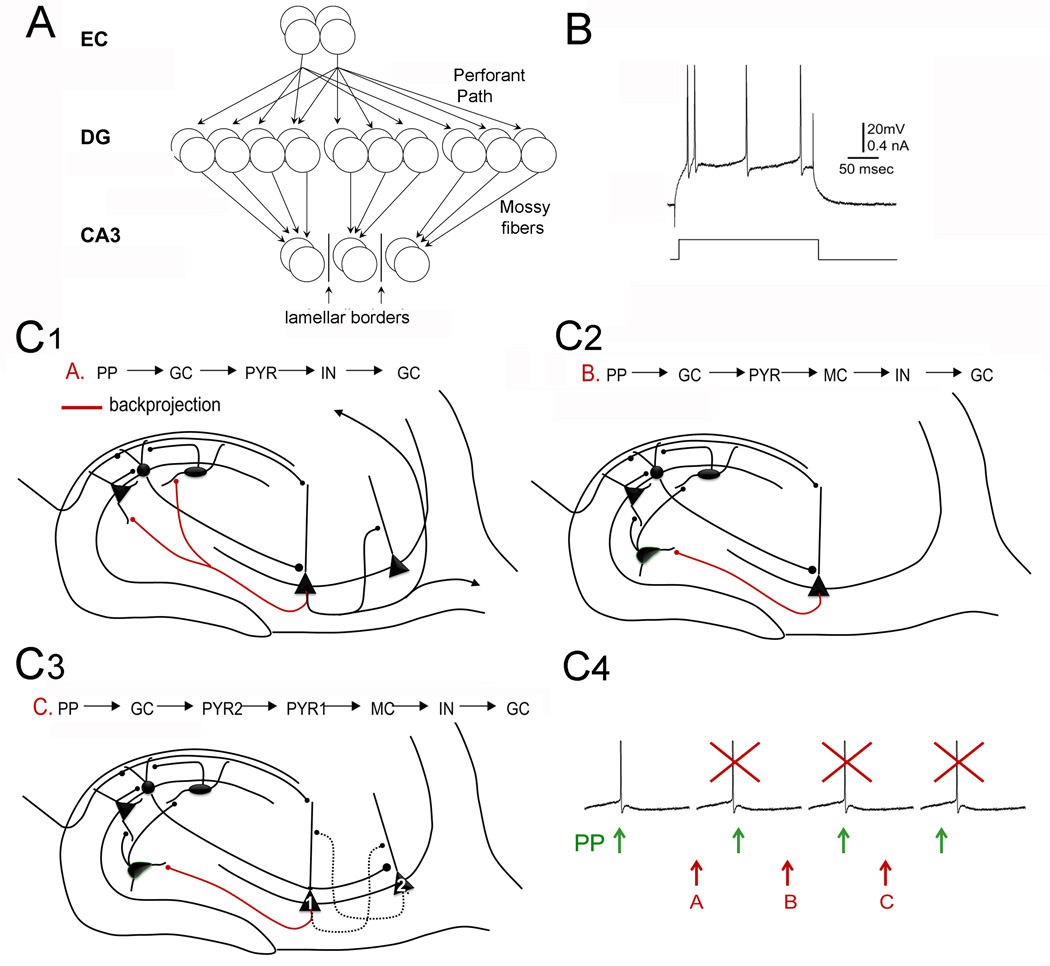
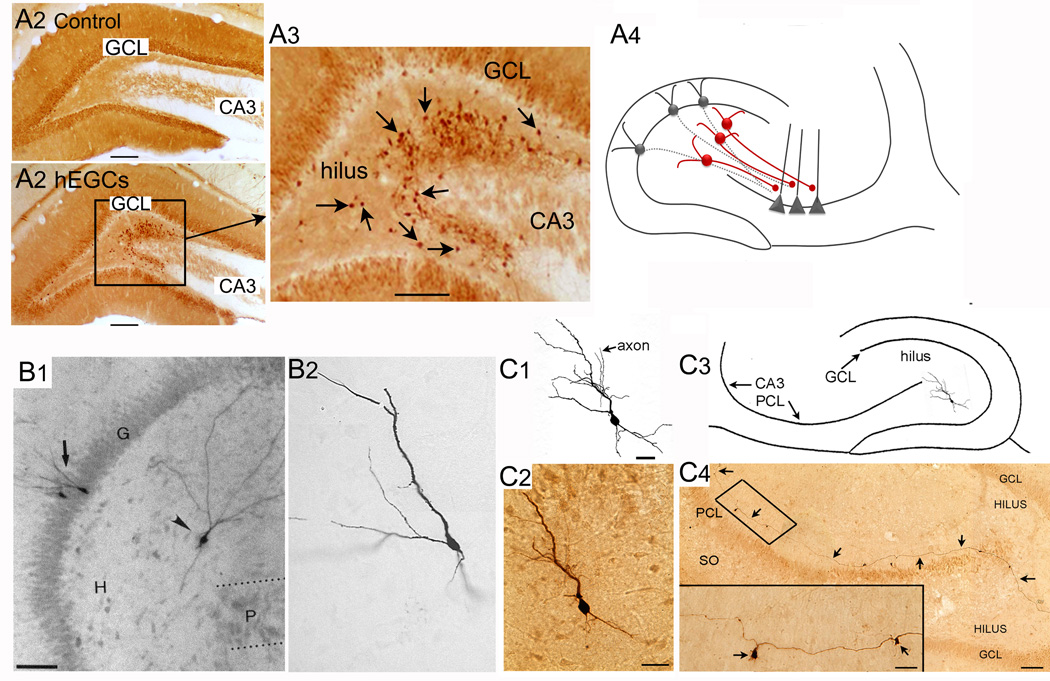
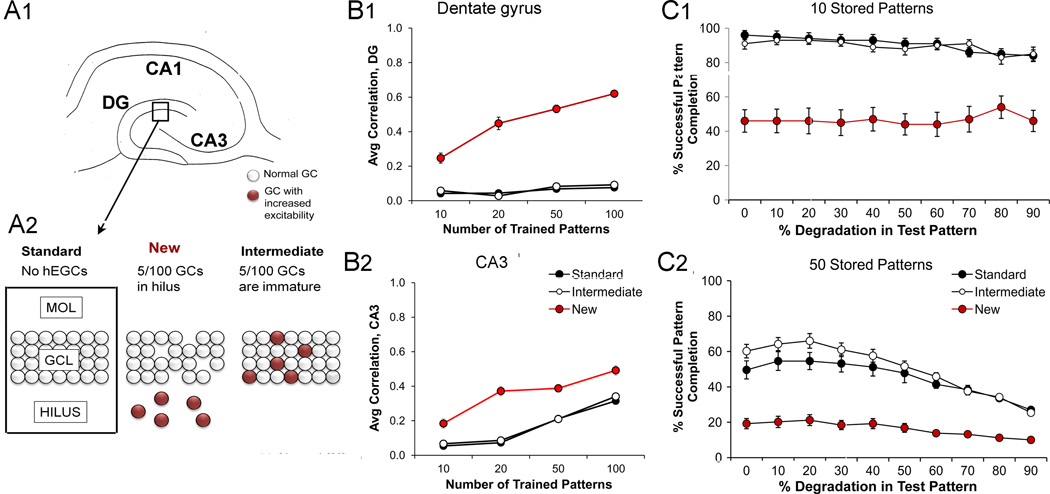
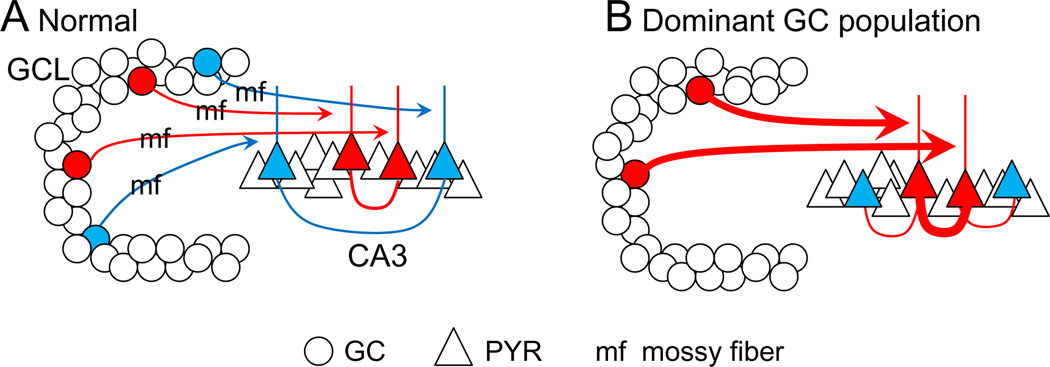
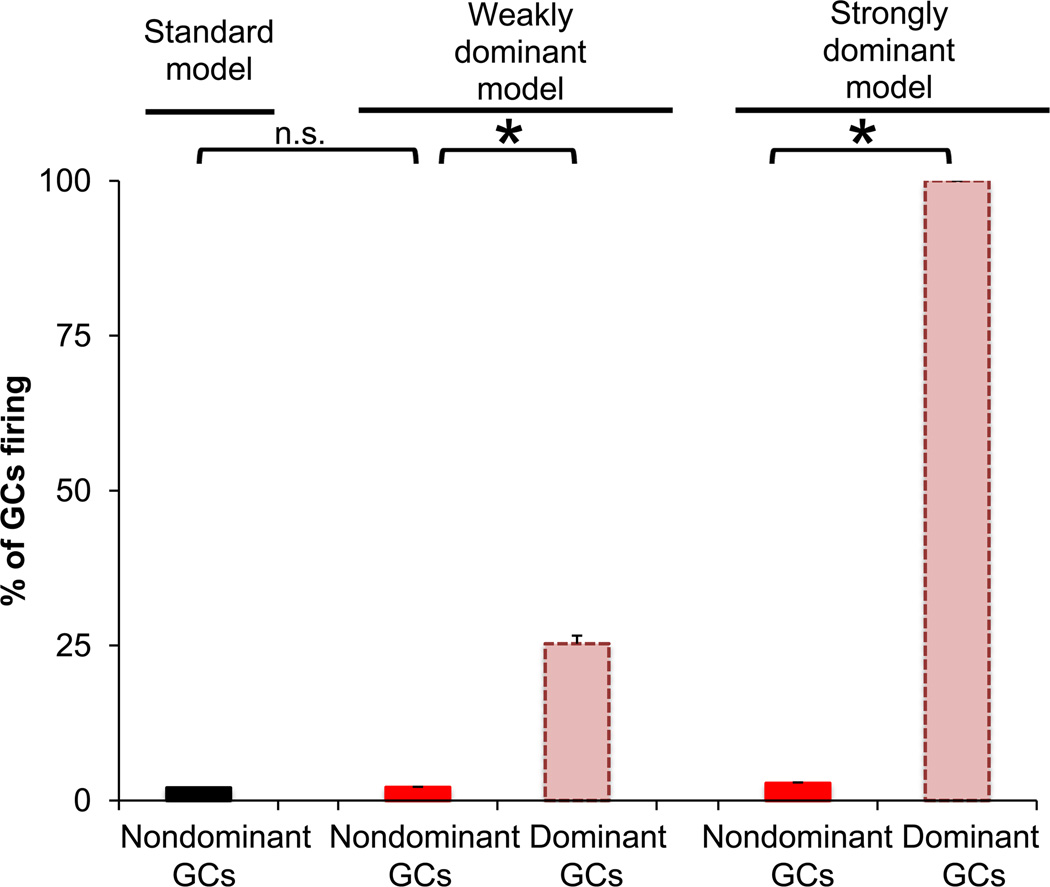
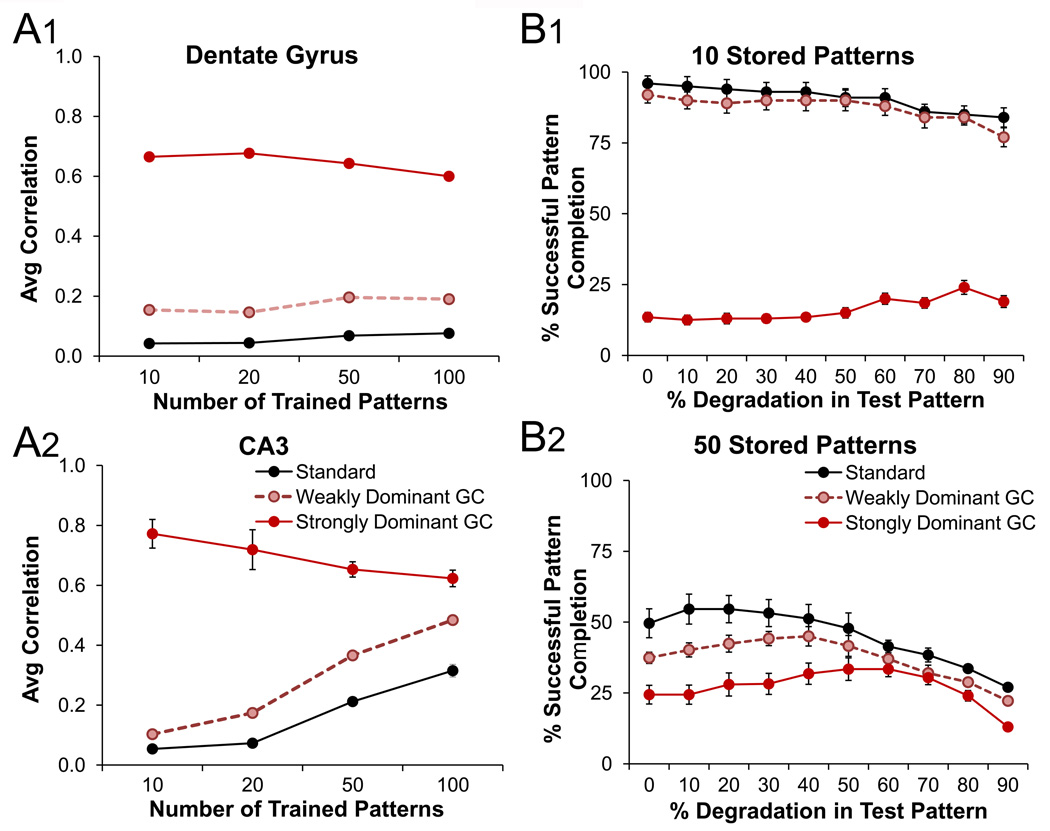
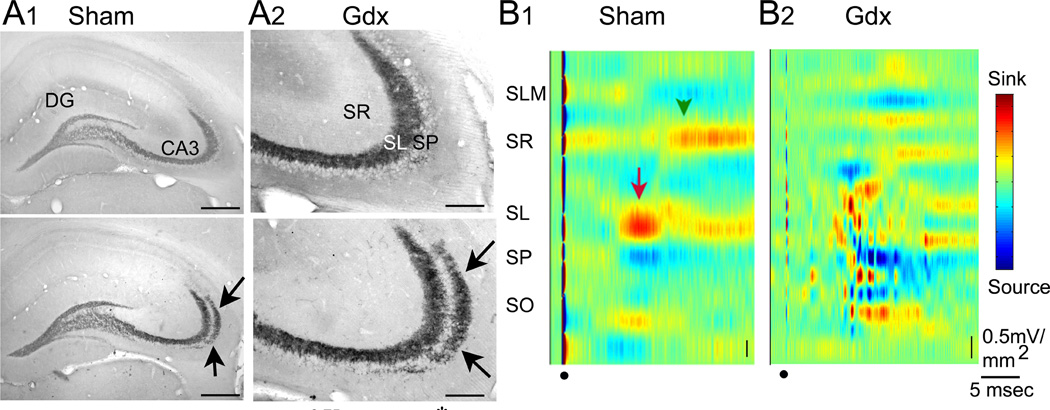
The dentate gyrus (DG) and area CA3 of the hippocampus are highly organized lamellar structures which have been implicated in specific cognitive functions such as pattern separation and pattern completion. Here we describe how the anatomical organization and physiology of the DG and CA3 are consistent with structures that perform pattern separation and completion. We then raise a new idea related to the complex circuitry of the DG and CA3 where CA3 pyramidal cell 'backprojections' play a potentially important role in the sparse firing of granule cells (GCs), considered important in pattern separation. We also propose that GC axons, the mossy fibers, already known for their highly specialized structure, have a dynamic function that imparts variance--'mossy fiber variance'--which is important to pattern separation and completion. Computational modeling is used to show that when a subset of GCs become 'dominant,' one consequence is loss of variance in the activity of mossy fiber axons and a reduction in pattern separation and completion in the model. Empirical data are then provided using an example of 'dominant' GCs--subsets of GCs that develop abnormally and have increased excitability. Notably, these abnormal GCs have been identified in animal models of disease where DG-dependent behaviors are impaired. Together these data provide insight into pattern separation and completion, and suggest that behavioral impairment could arise from dominance of a subset of GCs in the DG-CA3 network.

Keywords: Cognition; Computational modeling; Ectopic granule cells; Learning; Memory; Mossy fibers; Post-traumatic stress disorder (PTSD); Testosterone.


Figures

Figure 1
Figure 1
Modeling the DG-CA3 network. A1. The structure of the rodent DG is shown. There are three divisions of the molecular layer (MOL; outer, middle and inner), a granule cell layer (GCL) and hilus. The dotted line distinguishes the hilus from area CA3. In CA3 there are several layers: stratum oriens (SO), stratum pyramidale (SP), stratum lucidum (SL) where the mossy fiber pathway is located, stratum radiatum (SR) where the recurrent collaterals of pyramidal cells terminate, and stratum lacunosum-moleculare (SLM) where the entorhinal cortical projection (perforant path) innervates CA3 pyramidal cell distal dendrites. A2. Simplified schematic of some major pathways and cell types in the DG-CA3 model are shown. PP= perforant path. IN=interneuron. There are two types of IN shown in the DG, a perisomatic-targeting cell exemplified by the ‘basket’ cell with a pyramidal morphology (triangle) and a dendritic-targeting cell represented by the HIPP cell (oval; HIPP= hilar cell with an axon targeting the layer containing the p erforant path terminals). INs are also located in CA3 (oval). Note that the mossy fibers have both giant boutons as well as filamentous extensions that make synapses, primarily onto IN. MC=mossy cell. PYR= pyramidal cell. GC=granule cell. From (Myers et al., 2013). B. The DG-CA3 network model. Abbreviations as in part A. βHIPP, βMC and βIN are constants governing connection strengths in the model. For additional details, see (Myers & Scharfman, 2011; Myers et al., 2013).
Figure 2
Figure 2
Characteristics of the DG-CA3 network consistent with pattern separation and completion. A. The estimates of neuronal numbers for entorhinal cortex layer II neurons (the cells of origin of the perforant path projection, PP), DG GCs and CA3 pyramidal cells suggest a sparsification from the entorhinal cortex to the DG and CA3. B. Intrinsic properties of GCs make them unlikely to discharge repetitively for a very long time. An example is shown: a maintained depolarization to a GC (rectangular step) leads to a train of 4 action potentials with increasing interspike intervals. From (Scharfman et al., 2000). C1. The ‘backprojection’ of CA3 pyramidal cells (red) targets interneurons (IN) that innervate GCs (Scharfman, 2007a). The circuit that results is PP → GC → pyramidal cell → IN → GC and leads to GC inhibition. C2. The backprojection also innervates hilar mossy cells (MC) that innervate local INs to silence local GCs: PP → GC → pyramidal cell → MC → IN → GC (Scharfman 1994a,b; 1995). C3. Even if a given pyramidal cell does not project back to the DG, it may do so indirectly by recurrent collaterals to other pyramidal cell. C4. A schematic of a GC firing in response to the perforant path input (green arrow) or being silenced (red x) by inhibitory pathways as illustrated in C1 (A), C2 (B) or C3 (C). The result is inhibition of persistent GC firing. The backprojection shown in C1-C3 can potentially inhibit firing of GCs that were recently activated, and do so at different latencies. This would occur in the same lamella as the one where the GC was originally activated, because the circuitry in C1-C3 is primarily lamellar (Amaral & Witter, 1989). The outcome would be silencing of GCs in the same local area as those GCs that were recently activated by the perforant path.
Figure 3
Figure 3
Hilar ectopic GCs (hEGCs). A1. A calbindin-stained section from a control rat shows stained GCs in the granule cell layer (GCL), their dendrites and axons. Calibration (different sizes in A, B and C) is 100 µm. A2. A calbindin-stained section from a rat that was epileptic shows numerous calbindin-stained cells in the hilus (box) which is enlarged in A3. Arrows point to hEGCs. From (Scharfman et al., 2000). A4 A schematic illustrates the potential dominance of hEGCs (red) over normal GCs in the granule cell layer (grey) in the epileptic DG-CA3 network. B1-B2. Examples of hEGCs from epileptic rats. The hEGC was filled using an intracellular recording electrode which was also used to confirm the intrinsic electrophysiological properties were similar to GCs in the granule cell layer. B1 was previously shown in (Scharfman et al., 2000). C1-C4. A hEGC in a BAX−/− mouse showing the drawing (C1), filled cell (C2), location (C3) and mossy fiber axon (C4). From (Myers et al., 2013).
Figure 4
Figure 4
Effect of hEGCs in a computational model of DG-CA3. A. Three models were compared, a “Standard,” “New,” and “Intermediate” model. The Standard model was similar to that illustrated in Figure 1B and included entorhinal cortex (perforant path) inputs that projected directly to a CA3 network as well as indirectly via a DG network in which all GCs were “mature” and placed in the GC layer. The Intermediate model included a small proportion (5%) of “immature” GCs, located as usual in the granule cell layer, but slightly more excitable than normal “mature” GCs. The New model also included 5% immature GCs, but these were placed in the hilus, simulating hEGCs. B. To test pattern separation, pairs of entorhinal input patterns were presented, and correlation was computed between the output patterns generated in the DG or CA3 to the two input patterns. In the Standard model, average correlation was low in the DG, indicating successful pattern separation. Average correlation was also low in CA3 although the average correlation increased slowly as the number of trained input patterns increased. Results were similar in the Intermediate model. However, the average correlation was much higher in both the DG and CA3 of the New model, indicating decreased pattern separation when hEGCs were present. C. As a measure of pattern completion, the models were allowed to store a set of entorhinal input patterns and then tested with “partial” versions of the stored patterns in which various proportions of active elements were silenced (% degradation). When the number of stored patterns was low (C1), both the Standard and Intermediate models could usually retrieve the correct stored pattern even when degradation was high (e.g. up to 90% degradation), but the New model was severely impaired compared to the other models even when % degradation was low. When the number of stored patterns was high (C2), all models were impaired but the New model was most severely deficient. Together, these results indicate that presence of a small population of modestly hyperexcitable (immature) GCs in the granule cell layer is not sufficient to disrupt model behavior, but presence of a small population of dominant hEGCs disrupts both pattern separation and pattern completion. A and C were adapted from (Myers et al., 2013). B was based on modeling results presented previously (Myers et al., 2013).
Figure 5
Figure 5
Effects of hEGCs on GC firing in the Standard, Intermediate and New models (from Figure 4A). The percent of GCs that have suprathreshold activity (firing) are shown for different GC subtypes in the three computational models. In the Standard model, a small percentage (about 2%) of mature GCs fire in response to input from the entorhinal cortex along the perforant path. In the Intermediate model, a similar percentage of mature and immature GCs fire in response to perforant path input. But in the New model, the hEGCs are dominant, reflected in much higher firing rate of hEGCs relative to mature GCs in the granule cell layer, and a reduced rate of mature GCs compared to the Standard model. Thus, in the New model, the dominant hEGCs are not only highly active, but suppress activity in other non-dominant GCs. This leads to reduced variance in the GC input (mossy fibers) to CA3, which in turn produces the impaired pattern separation and completion seen in the New model (Figure 4B,C). Adapted from Figure 8A in (Myers et al., 2013).
Figure 6
Figure 6
The “dominant GC” hypothesis. A. Normally, a given entorhinal cortex (perforant path) input pattern activates a small number of GCs (red circles) which project via mossy fibers (arrows) to a group of pyramidal cells (red triangles); recurrent collaterals between co-active pyramidal cells can be strengthened, forming a cell assembly encoding that pattern. A different entorhinal input pattern activates a different subset of GCs and pyramidal cells (blue), which form a new cell assembly in CA3. B. A small group of “dominant GCs” (red) respond to many entorhinal input patterns and repeatedly target the same pyramidal cells (red), which become linked into a strong cell assembly that recruits additional pyramidal cells (blue). The outcome is impaired pattern separation and also impaired pattern completion (as shown in Figure 4B,C), because presentation of any entorhinal inputs will tend to evoke activity in the same subset of CA3 pyramidal cells.
Figure 7
Figure 7
Three DG-CA3 network models with different degrees of dominant GCs. As in Figure 5, the percent of GCs that have suprathreshold activity (firing) are shown for different GC subtypes. As in prior figures, presentation of entorhinal cortex input patterns in the Standard model produces sparse firing in the GCs located in the granule cell layer (black bar). However, when a small proportion (5%) of these GCs are made weakly dominant (Weakly-dominant model), by reducing the firing threshold from +0.75 to +0.05, many more of these dominant GCs fire in response to entorhinal input (light red); there is no change in firing among the remaining GCs (non-dominant, bright red). When the same small proportion of GCs (5%) are made strongly dominant (Strongly-dominant model) by reducing their firing threshold to 0.0, all of the dominant GCs (light red) fire in response to any entorhinal input. The non-dominant GCs remain unaffected (bright red). These findings are a contrast to Figure 5, where the presence of hEGCs (dominant GCs that are located in the hilus) produced a reduction in firing of GCs in the granule cell layer.
Figure 8
Figure 8
Pattern separation and pattern completion in the Standard, Weakly-dominant, and Strongly-dominant models (described in Figure 7). The presence of a small population (5%) of weakly-dominant GCs impaired pattern separation, indicated as increased correlation among the responses to stored patterns in both the DG (A1) and CA3 (A2). There also was impaired pattern completion (B1-B2), indicated as reduced ability to successfully retrieve stored patterns when partial (degraded) versions of those patterns were presented as input. The presence of strongly-dominant GCs severely degraded both pattern separation and pattern completion.
Figure 9
Figure 9
Increased mossy fiber variance with reduced testosterone levels in male rats. A. Gonadectomy of adult male rats led to structural plasticity of mossy fibers, reflected by mossy fiber sprouting into stratum oriens of CA3 (arrows). Surgery was conducted in young adult rats and comparisons were made between gonadectomized animals and age-matched animals subjected to anesthesia and surgerical opening of the abdomen, but no gonadectomy. The mossy fibers are stained by one of the peptides normally present in mossy fibers, dynorphin. Calibration in A1, 500 µm; calibration in A2, 100 µm. Abbreviations as for prevous figures. From (Skucas et al., 2013). B. Current source density analysis showed that in normal male rats, mossy fiber stimulation in hippocampal slices evoked a field potential with a sink in stratum lucidum (red arrow) followed by a later sink in stratum radiatum (red arrowhead). This pattern of activation is consistent with mossy fiber excitation of proximal pyramidal cell dendrites followed by recurrent collateral excitation of more distal dendrites. From (Skucas et al., 2013). On the right is a CSD for a gonadectomized male rat showing that the normally focal sink in stratum lucidum has lost its afferent specificity, indicating greater mossy fiber variance. From (Skucas et al., 2013).

Similar articles

Cited by

References

    1. Albert DJ, Walsh ML, Gorzalka BB, Siemens Y, Louie H. Testosterone removal in rats results in a decrease in social aggression and a loss of social dominance. Physiol Behav. 1986;36:401–407. - PubMed
    1. Alme CB, Buzzetti RA, Marrone DF, Leutgeb JK, Chawla MK, Schaner MJ, Bohanick JD, Khoboko T, Leutgeb S, Moser EI, Moser MB, McNaughton BL, Barnes CA. Hippocampal granule cells opt for early retirement. Hippocampus. 2010;20:1109–1123. - PubMed
    1. Althaus A, Sagher O, Parent JM, Murphy GG. Intrinsic Neurophysiological properties of hilar ectopic and nrmotopic dentate granule vells in human temporal lobe epilepsy and a rat model. J Neurophysiol. 2014;113:1184–1194. - PMC - PubMed
    1. Amaral DG, Witter MP. The three-dimensional organization of the hippocampal formation: A review of anatomical data. Neuroscience. 1989;31:571–591. - PubMed
    1. Amaral DG, Ishizuka N, Claiborne B. Neurons, numbers and the hippocampal network. In: Storm-Mathisen J, Zimmer J, Ottersen OP, editors. Prog Brain Res. Vol. 83. Elsevier Science; 1990. pp. 1–11. - PubMed

Publication types

MeSH terms