

Influence of Arrestin on the Photodecay of Bovine Rhodopsin
- PMID: 26383645
- PMCID: PMC4685475
- DOI: 10.1002/anie.201505798
Influence of Arrestin on the Photodecay of Bovine Rhodopsin
Abstract
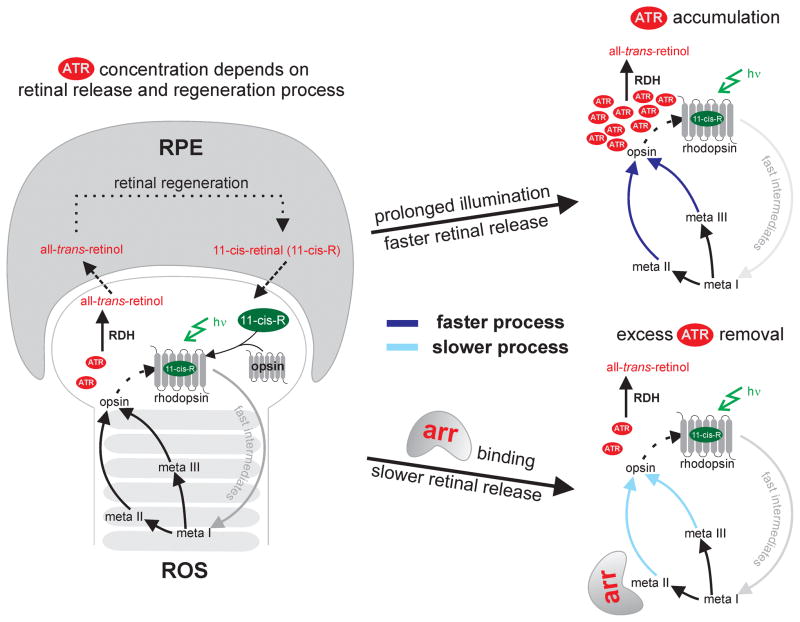
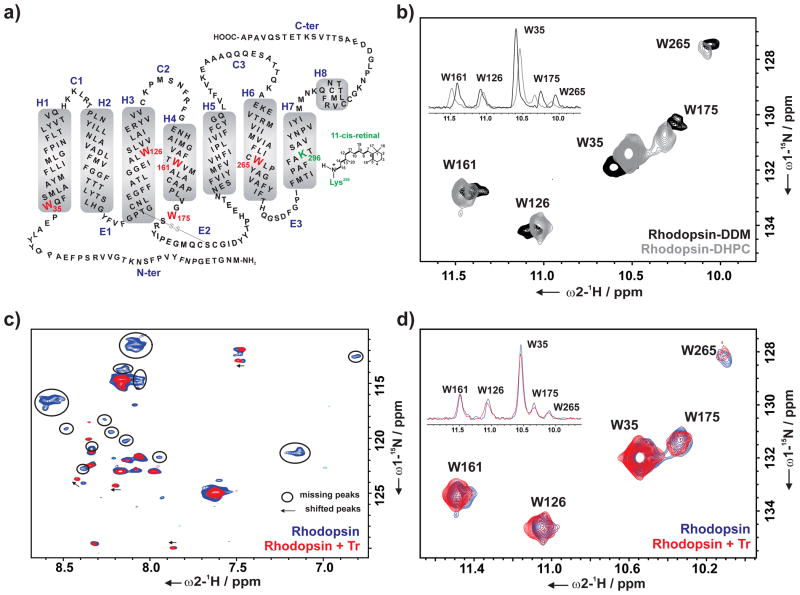
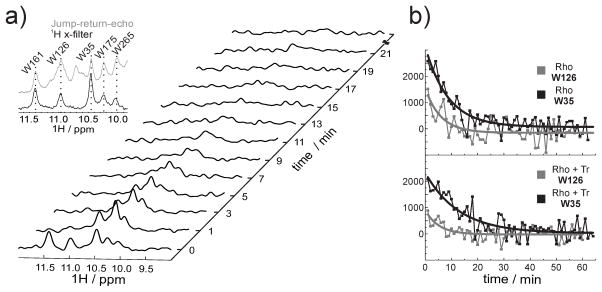
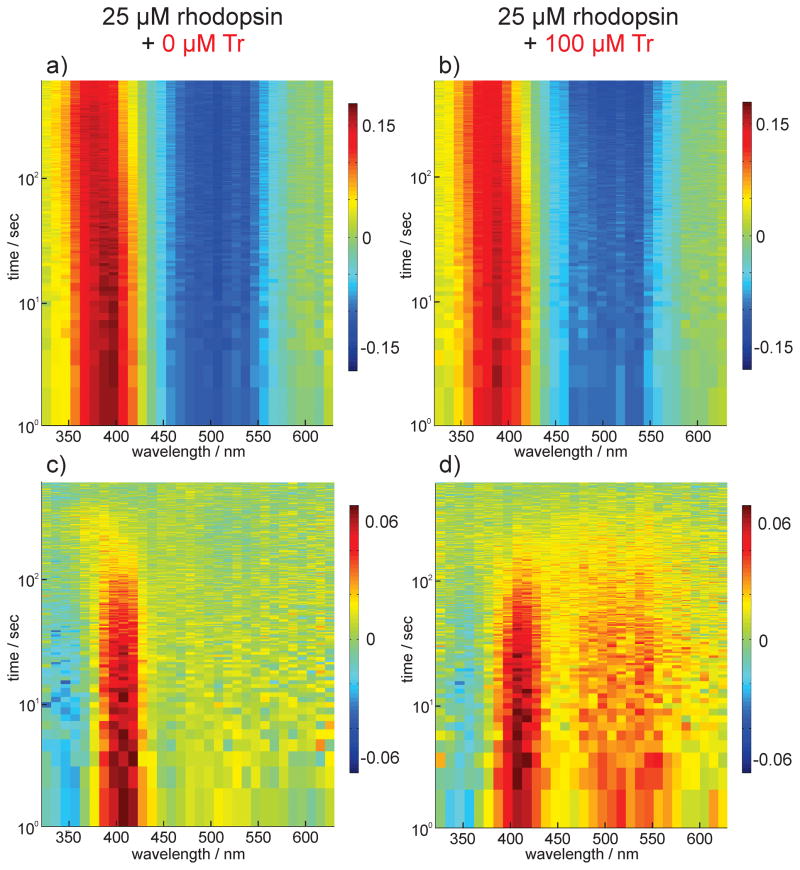
Continued activation of the photocycle of the dim-light receptor rhodopsin leads to the accumulation of all-trans-retinal in the rod outer segments (ROS). This accumulation can damage the photoreceptor cell. For retinal homeostasis, deactivation processes are initiated in which the release of retinal is delayed. One of these processes involves the binding of arrestin to rhodopsin. Here, the interaction of pre-activated truncated bovine visual arrestin (Arr(Tr)) with rhodopsin in 1,2-diheptanoyl-sn-glycero-3-phosphocholine (DHPC) micelles is investigated by solution NMR techniques and flash photolysis spectroscopy. Our results show that formation of the rhodopsin-arrestin complex markedly influences partitioning in the decay kinetics of rhodopsin, which involves the simultaneous formation of a meta II and a meta III state from the meta I state. Binding of Arr(Tr) leads to an increase in the population of the meta III state and consequently to an approximately twofold slower release of all-trans-retinal from rhodopsin.
Keywords: NMR spectroscopy; UV/Vis spectroscopy; arrestin; retinal regeneration; rhodopsin.
© 2015 WILEY-VCH Verlag GmbH & Co. KGaA, Weinheim.
Figures
Similar articles
-
Quantification of arrestin-rhodopsin binding stoichiometry.Methods Mol Biol. 2015;1271:235-50. doi: 10.1007/978-1-4939-2330-4_16. Methods Mol Biol. 2015. PMID: 25697528
-
Formation and decay of the arrestin·rhodopsin complex in native disc membranes.J Biol Chem. 2015 May 15;290(20):12919-28. doi: 10.1074/jbc.M114.620898. Epub 2015 Apr 6. J Biol Chem. 2015. PMID: 25847250 Free PMC article.
-
Dynamics of arrestin-rhodopsin interactions: arrestin and retinal release are directly linked events.J Biol Chem. 2005 Feb 25;280(8):6861-71. doi: 10.1074/jbc.M411341200. Epub 2004 Dec 9. J Biol Chem. 2005. PMID: 15591052
-
Involvement of distinct arrestin-1 elements in binding to different functional forms of rhodopsin.Proc Natl Acad Sci U S A. 2013 Jan 15;110(3):942-7. doi: 10.1073/pnas.1215176110. Epub 2012 Dec 31. Proc Natl Acad Sci U S A. 2013. PMID: 23277586 Free PMC article.
-
The role of arrestin and retinoids in the regeneration pathway of rhodopsin.J Biol Chem. 1992 Aug 5;267(22):15701-6. J Biol Chem. 1992. PMID: 1386362
Cited by
-
Rhodopsin kinase and arrestin binding control the decay of photoactivated rhodopsin and dark adaptation of mouse rods.J Gen Physiol. 2016 Jul;148(1):1-11. doi: 10.1085/jgp.201511538. J Gen Physiol. 2016. PMID: 27353443 Free PMC article.
-
Functional map of arrestin binding to phosphorylated opsin, with and without agonist.Sci Rep. 2016 Jun 28;6:28686. doi: 10.1038/srep28686. Sci Rep. 2016. PMID: 27350090 Free PMC article.
-
Light Dynamics of the Retinal-Disease-Relevant G90D Bovine Rhodopsin Mutant.Angew Chem Int Ed Engl. 2020 Sep 1;59(36):15656-15664. doi: 10.1002/anie.202003671. Epub 2020 Aug 13. Angew Chem Int Ed Engl. 2020. PMID: 32602600 Free PMC article.
-
Real-time nuclear magnetic resonance spectroscopy in the study of biomolecular kinetics and dynamics.Magn Reson (Gott). 2021 May 11;2(1):291-320. doi: 10.5194/mr-2-291-2021. eCollection 2021. Magn Reson (Gott). 2021. PMID: 37904763 Free PMC article. Review.
References
Publication types
MeSH terms
Substances
Grants and funding
LinkOut - more resources
Full Text Sources
Other Literature Sources
