. 2015 Sep 14:5:13953.
doi: 10.1038/srep13953.

IP3R deficit underlies loss of salivary fluid secretion in Sjögren's Syndrome

Affiliations

IP3R deficit underlies loss of salivary fluid secretion in Sjögren's Syndrome

Leyla Y Teos et al. Sci Rep. .

Abstract

The autoimmune exocrinopathy, Sjögren's syndrome (SS), is associated with secretory defects in patients, including individuals with mild lymphocytic infiltration and minimal glandular damage. The mechanism(s) underlying the secretory dysfunction is not known. We have used minor salivary gland biopsies from SS patients and healthy individuals to assess acinar cell function in morphologically intact glandular areas. We report that agonist-regulated intracellular Ca(2+) release, critically required for Ca(2+) entry and fluid secretion, is defective in acini from SS patients. Importantly, these acini displayed reduction in IP3R2 and IP3R3, but not AQP5 or STIM1. Similar decreases in IP3R and carbachol (CCh)-stimulated [Ca(2+)]i elevation were detected in acinar cells from lymphotoxin-alpha (LTα) transgenic (TG) mice, a model for (SS). Treatment of salivary glands from healthy individuals with LT α, a cytokine linked to disease progression in SS and IL14α mice, reduced Ca(2+) signaling. Together, our findings reveal novel IP3R deficits in acinar cells that underlie secretory dysfunction in SS patients.


Figures

Figure 1
Figure 1. Morphology of minor salivary glands from healthy volunteers (HV) and primary Sjögren’s patients (pSS).
Samples from (HV) and pSS patients with focus scores (FS) of 1, 3 and 5 were stained with hematoxolin and eosin. Morphology was assessed using 20× objectives. (A–D show larger areas of the tissue sample while enlarged areas of the portions marked are shown in (a–d). Relatively intact morphologically normal looking areas in the sections are shown by black arrows, while infiltrated areas are indicated by red arrows. Samples from pSS patient with FS = 5 (D, d) displays diffused infiltration with little residual gland morphology (E) Displaying whole unstimulated salivary flow measured in individual HV (N = 22) and pSS FS = 1 patients (N = 11). Mean ± SEM for the HV group is 5.827 ± 0.8556 ml/15 min and for the pSS group, 1.759 ± 0.4334 ml/15 mins (* denotes a significant difference between Means, p < 0.0001). (A–D, scale bar = 100 microns) (a–d, scale bar = 50 microns).
Figure 2
Figure 2. Carbachol-stimulated decrease in acinar cell volume is attenuated in minor salivary gland biopsies from pSS patients.
(A) Calcein fluorescence was monitored in acinar cells using confocal microscopy. The data in A were used to quantitate: (B) Decrease in volume in HV (20.61017 F/F0 ± 1.29369) vs in the pSS patients (10.4703 F/F0 ± 0.94543) (C) Initial rate of volume decrease in HV and pSS cells (0.1861 F/F0/Sec ± 0.01837 in the HV versus 0.09333 F/F0/Sec ± 0.006863 in the pSS individuals (p < 0.0001). (D) Spearman r correlation between CCh-stimulated volume decrease and salivary flow in the pSS patients (red symbols) and HV (black symbols) (p = 0.0323, eleven HV, and thirteen pSS). (E) Spread of CCh-stimulate volume changes in individual patients from HV and pSS groups (p = 0.0010). * indicates significant difference.
Figure 3
Figure 3. Carbachol-stimulated Ca2+ signaling is decreased in pSS.
(A) Fluo2 fluorescence was recorded in cell lobules and stimulated with 1μM carbachol in Ca2+ free medium, followed by inclusion of 1 mM Ca2+ to the external medium. Traces are representative of data from one experiment, values are averages from 3-4 samples (minimum of 40 ROIs) (B) Quantitation of first peak increase in fluorescence (representing internal [Ca2+]i release in cells from pSS patients (0.8129 ± 0.09980) in 121 cells from eleven patients) and seven HV individuals (2.196 F/F0 ± 0.1357, 105 cells, 7 patients), * indicates significant difference (P < 0.0001). (C) Quantitation of second peak of fluorescence increase (due to Ca2+ entry) from eleven pSS patients and seven HV (0.4275 ± 0.14583 121 cells and 2.20134 F/F0 ± 0.2099, 105 cells). * indicates a significant difference P<0.0001. (D) Dose-dependence of CCh-stimulated increases in [Ca2+]i in acinar cells from HV (5 individuals) and pSS patients glands (8 patients) in Ca2+-containing medium. (E&F) CCh-stimulated increase in fluorescence in Ca2+-containing and Ca2+-free media from HV and pSS patients. (G&H) Spearman r correlation between CCh-stimulated volume changes versus intracellular Ca2+ release (p = 0.0166) and Ca2+ influx (p = 0.0043), respectively, in seven HV and eleven pSS patients.
Figure 4
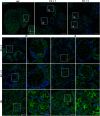
Figure 4. IP3R3 expression in minor salivary glands biopsies of pSS patients and healthy volunteers.
Stitched Immunofluorescence images of IP3R3 in entire biopsied sample area (scale bar = 300 microns). Area labeled 1 and 2 were randomly picked areas from HV. Representative images of IP3R3 detected by immunofluorescence in salivary gland sections from pSS patients with FS = 1, FS = 3. An area from within the infiltration (IF) was picked and an area away from infiltration where tissue appeared to be morphologically intact (N). In each case, enlarged images (of areas marked by white boxes) are shown in the second panel to the right (scale bar = 20 microns). Areas were picked from stitched images shown in the 1st panel (scale bar = 50 microns).
Figure 5
Figure 5. IP3R2 expression in minor salivary glands biopsies of pSS patients and healthy volunteers.
Representative images of IP3R2 detected by immunofluorescence in salivary gland sections from pSS patients with FS = 3, FS = 5, and healthy volunteers (HV) (scale bar = 50 microns). An area from within the infiltration (IF) was picked and an area away from infiltration where tissue appeared to be morphologically intact (N). In each case, enlarged images (of areas marked by white boxes) are shown in the second panel to the right (scale bar = 20 microns).
Figure 6
Figure 6. Ca2+ Signaling in lobules from IL14 alpha transgenic mice.
(A) Representative traces from female, age matched wild type controls showing the concentration-dependent change in [Ca2+]i stimulated by a range of [CCh] in submandibular acini. The traces represent the normalized change in fluorescence for an individual cell within an acinus. Cells from different acini in the field of view in one lobule are presented. Experiments were performed on at least 9 lobules from 3 different animals. (B) [Ca2+] signals are significantly reduced in IL14α animals. (C) Pooled data. [Ca2+] signals are significantly reduced in response to sub-maximal [CCh] *p = <0.01.
Figure 7
Figure 7. IP3R2 expression in submandibular salivary glands from female IL14 alpha transgenic mice.
(A) Left panel shows the typical apical staining of IP3R2 in age matched control animals. Middle panel show the basal localization of the Na/K-ATPase. Right panel overlay of IP3R2 and Na/K-ATPase localization. (B) Left panel shows the typical apical staining of IP3R2 in male 10 month old IL14a animals. Middle panel show the basal localization of the Na/K-ATPase. Right panel overlay of IP3R2 and Na/K-ATPase localization. (C) Left panel shows the absence of typical apical staining of IP3R2 in female 10 month old IL14a animals. Middle panel show the basal localization of the Na/K-ATPase. Right panel overlay of IP3R2 and Na/K-ATPase localization. (scale bar = 10 microns).
Figure 8
Figure 8. Ca2+ signaling in minor salivary glands from HV incubated with (LTα).
(A) Representative traces from lobules prepared from HV minor salivary glands incubated at 37 °C for 16 hrs showing the concentration-dependent change in [Ca2+]i stimulated by a range of (CCh). The traces represent the normalized change in fluorescence for an individual cell within an acinus. Cells from different acini in the field of view in one lobule are presented. Experiments were performed on at least 9 lobules from 4 individual volunteers. (B) [Ca2+] signals are significantly reduced in lobules incubated with 100 ng/ml (LTα). (C) Pooled data. [Ca2+] signals are significantly reduced in response to sub-maximal [CCh] *p = <0.01.

Similar articles

Cited by

References

    1. Delaleu N., Jonsson R. & Koller M. M. Sjogren’s syndrome. European journal of oral sciences 113, 101-113, 10.1111/j.1600-0722.2004.00183.x (2005). - DOI - PubMed
    1. Mavragani C. P. & Moutsopoulos H. M. The geoepidemiology of Sjogren’s syndrome. Autoimmunity reviews 9, A305–310, 10.1016/j.autrev.2009.11.004 (2010). - DOI - PubMed
    1. Fox R. I. Sjogren’s syndrome. Lancet 366, 321–331, 10.1016/S0140-6736(05)66990-5 (2005). - DOI - PubMed
    1. Vitali C. et al. Classification criteria for Sjogren’s syndrome: a revised version of the European criteria proposed by the American-European Consensus Group. Annals of the rheumatic diseases 61, 554–558 (2002). - PMC - PubMed
    1. Hansen A., Lipsky P. E. & Dorner T. Immunopathogenesis of primary Sjogren’s syndrome: implications for disease management and therapy. Current opinion in rheumatology 17, 558–565 (2005). - PubMed

Publication types

MeSH terms